BNB Price Targets $650 Amid Renewed Market Optimism


BNB price is consolidating above the $605 support zone. The price is now showing positive signs and might aim for more gains in the near term.
- BNB price is attempting to recover from the $600 support zone.
- The price is now trading above $612 and the 100-hourly simple moving average.
- There is a key bullish trend line forming with support near $622 on the hourly chart of the BNB/USD pair (data source from Binance).
- The pair must stay above the $612 level to start another increase in the near term.
BNB Price Eyes More Gains
After forming a base above the $600 level, BNB price started a fresh increase. There was a move above the $605 and $612 resistance levels, like Ethereum and Bitcoin .
The bulls even pushed the price above the $625 level. A high was formed at $629 and the price is now consolidating gains above the 23.6% Fib retracement level of the recent wave from the $597 swing low to the $629 high.
The price is now trading above $622 and the 100-hourly simple moving average. There is also a key bullish trend line forming with support near $622 on the hourly chart of the BNB/USD pair.
On the upside, the price could face resistance near the $628 level. The next resistance sits near the $630 level. A clear move above the $630 zone could send the price higher. In the stated case, BNB price could test $642. A close above the $642 resistance might set the pace for a larger move toward the $650 resistance. Any more gains might call for a test of the $655 level in the near term.
Another Decline?
If BNB fails to clear the $630 resistance, it could start another decline. Initial support on the downside is near the $622 level. The next major support is near the $620 level.
The main support sits at $612 and the 50% Fib retracement level of the recent wave from the $597 swing low to the $629 high. If there is a downside break below the $612 support, the price could drop toward the $605 support. Any more losses could initiate a larger decline toward the $600 level.
Technical Indicators
Hourly MACD – The MACD for BNB/USD is gaining pace in the bullish zone.
Hourly RSI (Relative Strength Index) – The RSI for BNB/USD is currently above the 50 level.
Major Support Levels – $622 and $612.
Major Resistance Levels – $630 and $642.

Sovereigns Are Buying Billions Of Bitcoin, Says Anthony Scaramucci
Bitcoin blasted back through the psychologically charged $100,000 threshold for only the second time...
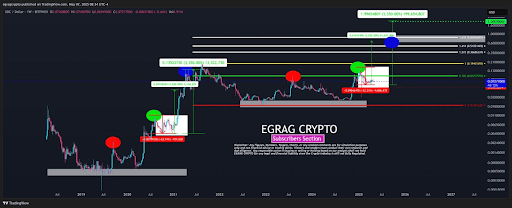
XRP Analyst Marks XDC For 3,350% Take-Off As Bullish Metrics Emerge
XRP analyst Egrag Crypto, who is well-known for offering bullish predictions about the altcoin, has ...
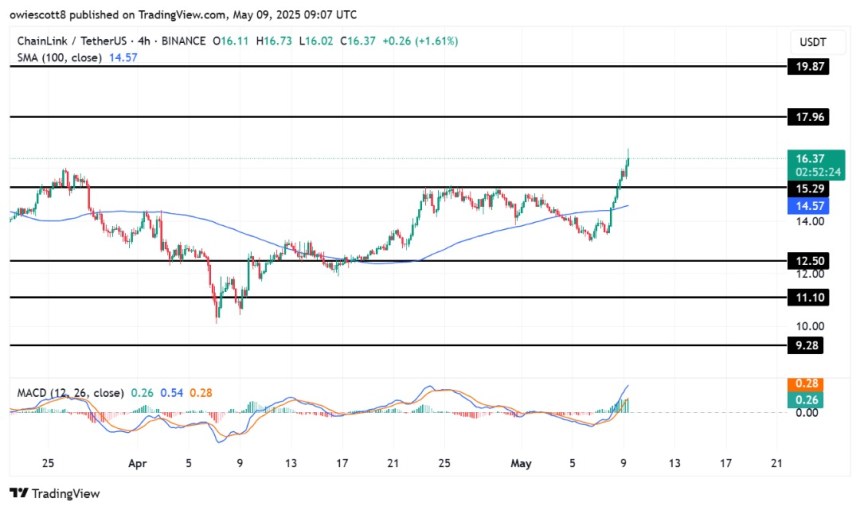
Chainlink Holds Strong At $15.29 Support – Is A New Breakout Imminent?
Chainlink (LINK) continues to showcase resilience, holding firm within a well-established uptrend as...