XRP Price Sinks Lower, But Chart Whisperers See a Trap for The Bears


XRP price started a downside correction below the $2.50 zone. The price is now consolidating and might find bids near the $2.350 support zone.
- XRP price started a fresh decline below the $2.550 zone.
- The price is now trading below $2.50 and the 100-hourly Simple Moving Average.
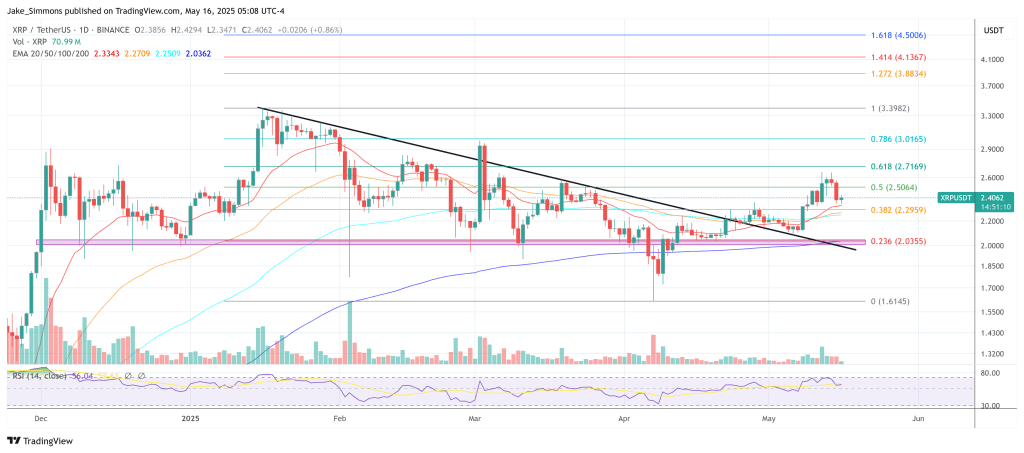
- There is a key bearish trend line forming with resistance at $2.420 on the hourly chart of the XRP/USD pair (data source from Kraken).
- The pair might start another increase if it stays above the $2.350 support.
XRP Price Dips Further
XRP price started a downside correction from the $2.650 zone, like Bitcoin and Ethereum . The price dipped below the $2.60 and $2.55 levels to enter a short-term bearish zone.
The bears were able to push the price below the $2.50 support zone. Finally, the bulls appeared near $2.350. A low was formed at $2.348 and the price is now consolidating losses below the 23.6% Fib retracement level of the downward move from the $2.650 swing high to the $2.348 low.
The price is now trading below $2.50 and the 100-hourly Simple Moving Average. On the upside, the price might face resistance near the $2.420 level. There is also a key bearish trend line forming with resistance at $2.420 on the hourly chart of the XRP/USD pair.
The first major resistance is near the $2.450 level. The next resistance is $2.50 and the 50% Fib retracement level of the downward move from the $2.650 swing high to the $2.348 low.
A clear move above the $2.50 resistance might send the price toward the $2.60 resistance. Any more gains might send the price toward the $2.650 resistance or even $2.680 in the near term. The next major hurdle for the bulls might be $2.80.
More Losses?
If XRP fails to clear the $2.50 resistance zone, it could start another decline. Initial support on the downside is near the $2.350 level. The next major support is near the $2.320 level.
If there is a downside break and a close below the $2.320 level, the price might continue to decline toward the $2.20 support. The next major support sits near the $2.120 zone.
Technical Indicators
Hourly MACD – The MACD for XRP/USD is now losing pace in the bearish zone.
Hourly RSI (Relative Strength Index) – The RSI for XRP/USD is now below the 50 level.
Major Support Levels – $2.350 and $2.320.
Major Resistance Levels – $2.420 and $2.50.
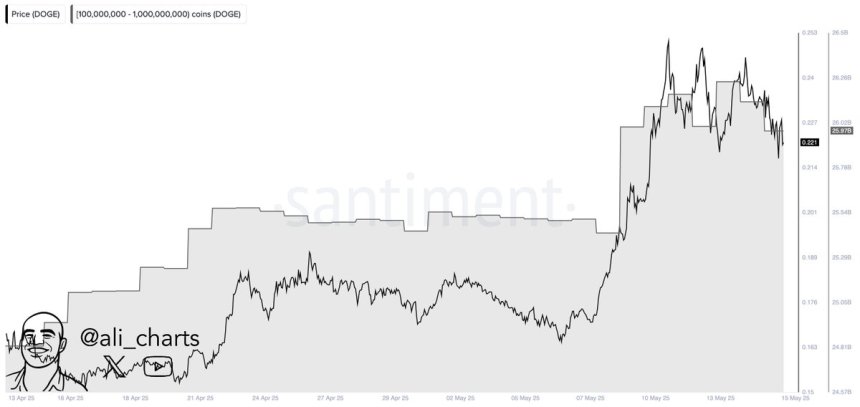
Dogecoin Whales Accumulate 1 Billion DOGE In A Month: Fueling Price Surge Speculation
Dogecoin is back in the spotlight after surging more than 50% in recent weeks, reclaiming bullish mo...

Ethereum Looks Ready To Break Out Of 4-Year Consolidation, Analyst Says Price Will ‘Go Insane’
Ethereum is again looking bullish following its gains of over 17% in the last seven days and the bre...
‘What If XRP Is The Next Bitcoin?’ Says Dave Portnoy
Dave Portnoy, the outspoken founder of Barstool Sports, used his debut appearance at CoinDesk’s Cons...