BNB Price Finds Its Footing — Can Bulls Ignite the Next Leg Up?


BNB price is consolidating above the $640 support zone. The price is now showing positive signs and might aim for more gains in the near term.
- BNB price is attempting to recover from the $640 support zone.
- The price is now trading above $655 and the 100-hourly simple moving average.
- There was a break above a connecting bearish trend line with resistance at $652 on the hourly chart of the BNB/USD pair (data source from Binance).
- The pair must stay above the $642 level to start another increase in the near term.
BNB Price Eyes Upside Break
After forming a base above the $642 level, BNB price started a fresh increase. There was a move above the $650 and $655 resistance levels, like Ethereum and Bitcoin .
There was a decent move above the 50% Fib retracement level of the recent decline from the $671 swing high to the $642 low. Besides, there was a break above a connecting bearish trend line with resistance at $652 on the hourly chart of the BNB/USD pair.
The price is now trading above $655 and the 100-hourly simple moving average. On the upside, the price could face resistance near the $660 level. It is close to the 61.8% Fib retracement level of the recent decline from the $671 swing high to the $642 low.
The next resistance sits near the $670 level. A clear move above the $670 zone could send the price higher. In the stated case, BNB price could test $678. A close above the $678 resistance might set the pace for a larger move toward the $685 resistance. Any more gains might call for a test of the $700 level in the near term.
Another Decline?
If BNB fails to clear the $660 resistance, it could start another decline. Initial support on the downside is near the $652 level. The next major support is near the $650 level.
The main support sits at $642. If there is a downside break below the $642 support, the price could drop toward the $630 support. Any more losses could initiate a larger decline toward the $620 level.
Technical Indicators
Hourly MACD – The MACD for BNB/USD is gaining pace in the bullish zone.
Hourly RSI (Relative Strength Index) – The RSI for BNB/USD is currently above the 50 level.
Major Support Levels – $650 and $642.
Major Resistance Levels – $660 and $670.
Bitcoin Next Leg Up Loading? Analyst Says BTC Could Trade Sideways For Two Weeks
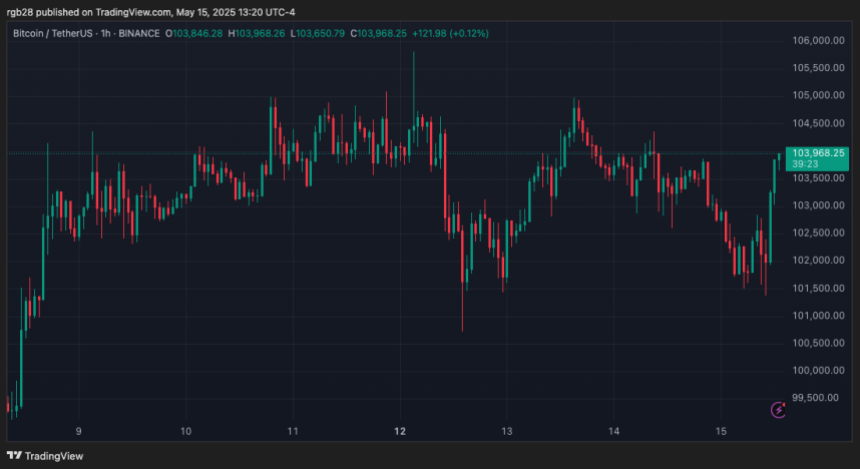
After reclaiming the crucial $100,000, Bitcoin (BTC) is testing its recently recovered levels as sup...

Bitcoin Rally Stalls as SOPR Spikes: Analyst Explains What It Means
Bitcoin’s recent climb appears to have momentarily slowed following a period of consistent upward mo...
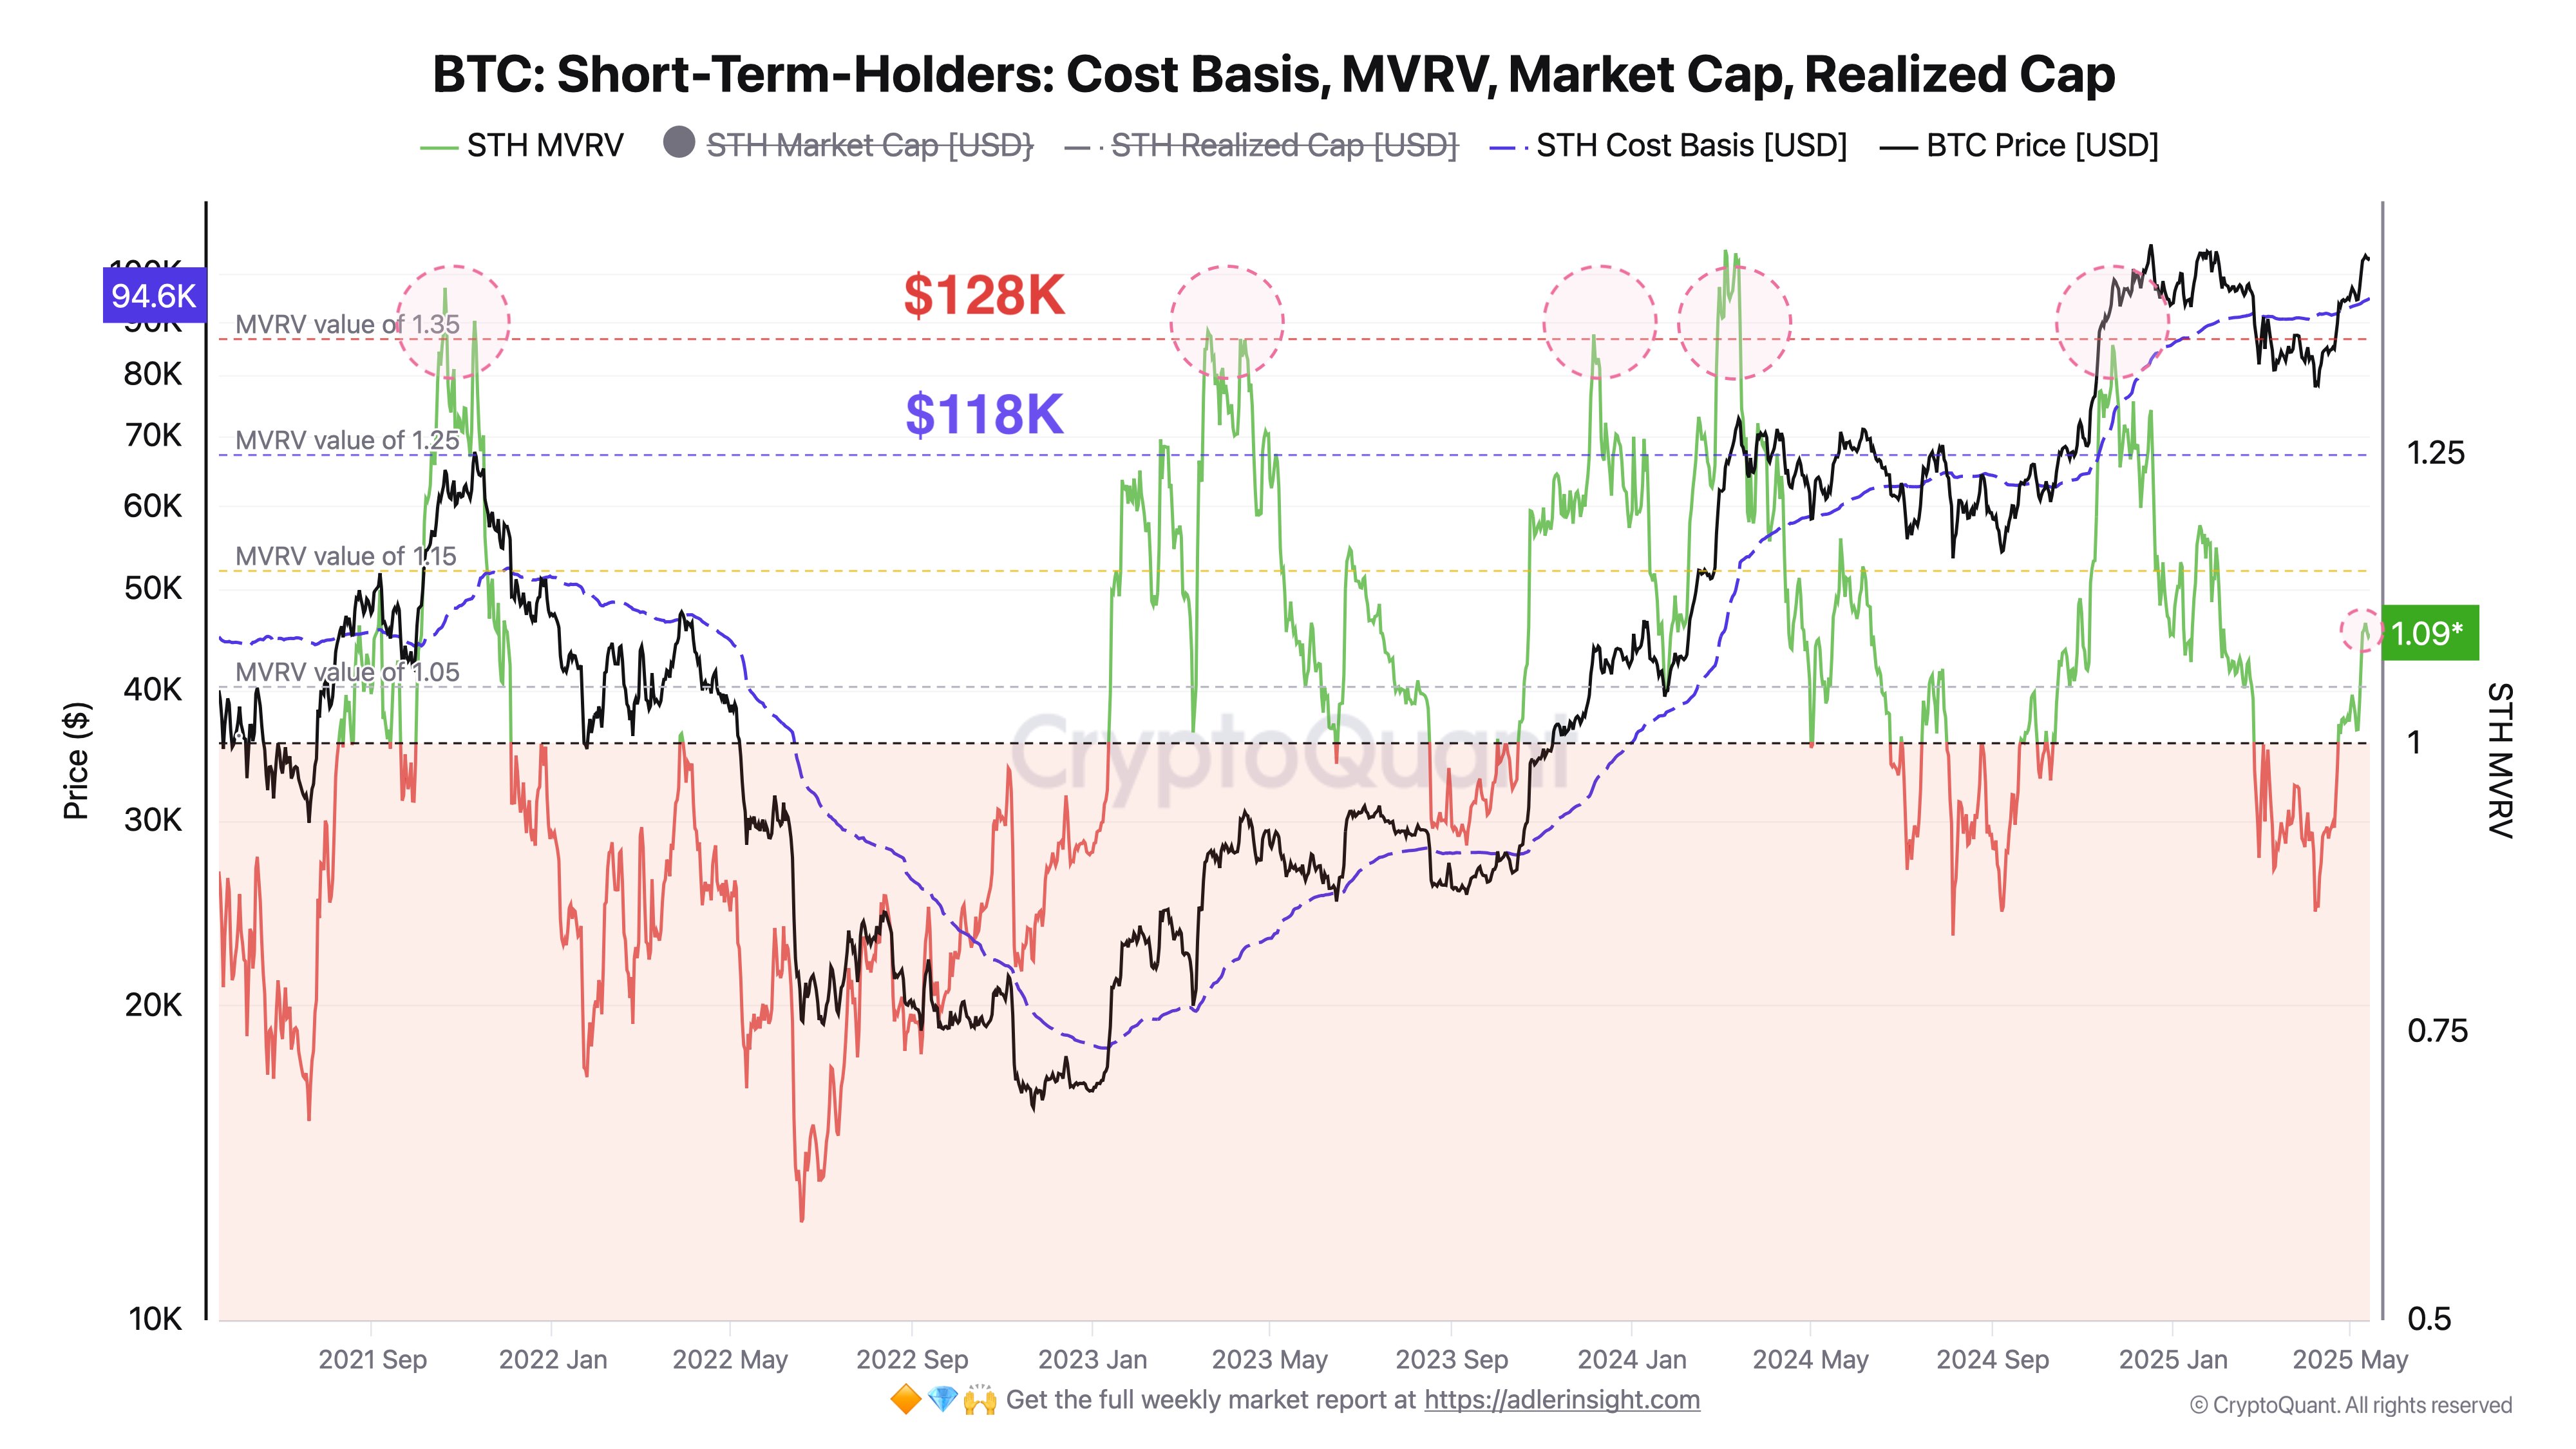
Bitcoin Could See Short-Term Holder Selloff Around These Levels, Analyst Says
An analyst has explained how Bitcoin could face significant waves of selling pressure from the short...