XRP Price Slips Again — Is a Deeper Correction Underway?


XRP price started a fresh decline below the $2.280 zone. The price is now correcting losses and might aim for a move above the $2.250 resistance.
- XRP price started a fresh decline below the $2.280 zone.
- The price is now trading below $2.270 and the 100-hourly Simple Moving Average.
- There is a key bearish trend line forming with resistance at $2.270 on the hourly chart of the XRP/USD pair (data source from Kraken).
- The pair might start another decline if it fails to clear the $2.2440 level.
XRP Price Dips Further
XRP price failed to clear the $0.3550 resistance and started a fresh decline, like Bitcoin and Ethereum . There was a move below the $0.3000 and $0.280 support levels.
The price even dipped below the $0.220 support level. A low was formed at $0.2132 and the price is now consolidating losses. There was a minor move above the $0.220 level. The price cleared the 23.6% Fib retracement level of the downward wave from the $2.3540 swing high to the $2.2132 low.
The price is now trading below $2.30 and the 100-hourly Simple Moving Average. On the upside, the price might face resistance near the $2.2440 level. It is near the 50% Fib retracement level of the downward wave from the $2.3540 swing high to the $2.2132 low.
The first major resistance is near the $2.270 level. There is also a key bearish trend line forming with resistance at $2.270 on the hourly chart of the XRP/USD pair.
The next resistance is $2.30. A clear move above the $2.30 resistance might send the price toward the $2.320 resistance. Any more gains might send the price toward the $2.350 resistance or even $2.3650 in the near term. The next major hurdle for the bulls might be $2.420.
Another Drop?
If XRP fails to clear the $2.270 resistance zone, it could start another decline. Initial support on the downside is near the $2.180 level. The next major support is near the $2.160 level.
If there is a downside break and a close below the $2.160 level, the price might continue to decline toward the $2.120 support. The next major support sits near the $2.080 zone.
Technical Indicators
Hourly MACD – The MACD for XRP/USD is now gaining pace in the bearish zone.
Hourly RSI (Relative Strength Index) – The RSI for XRP/USD is now below the 50 level.
Major Support Levels – $2.180 and $2.160.
Major Resistance Levels – $2.2440 and $2.270.
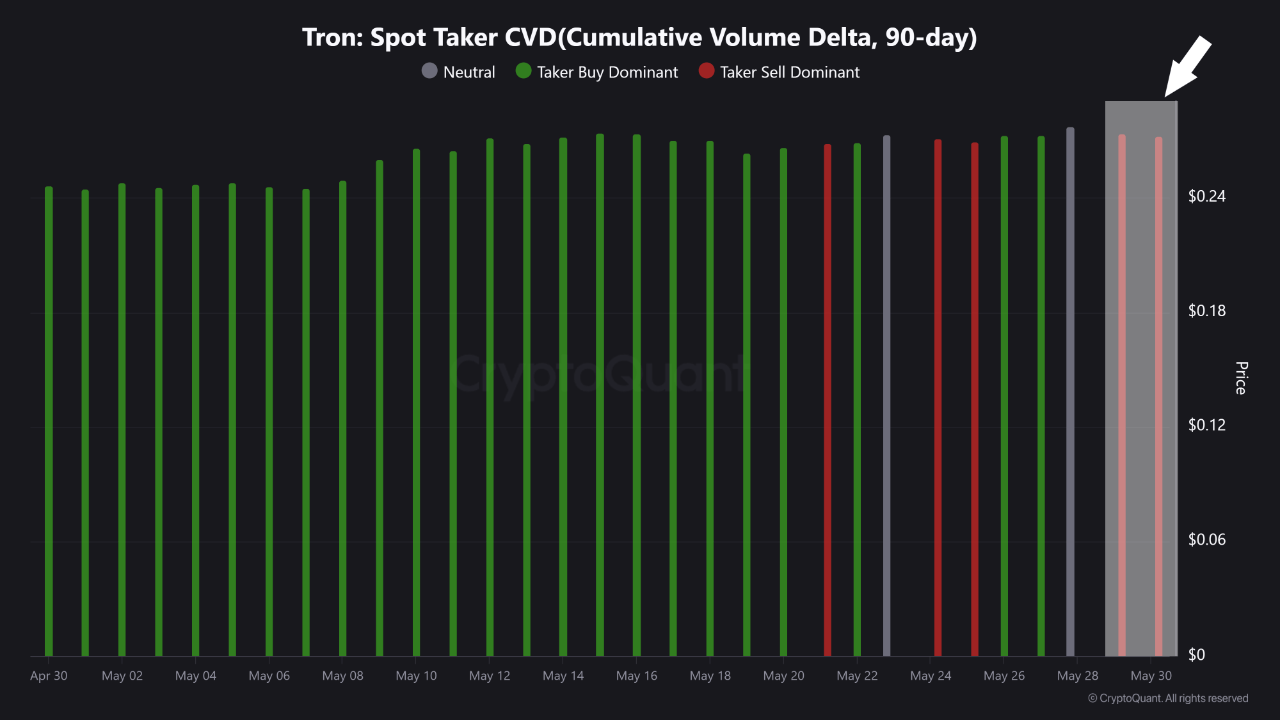
Analyst Explains Reason Behind Tron Price Sluggishness — Are TRX Bears Now In Control?
The Tron price has continued on its recovery path since reaching a bottom in mid-March, steadily cli...
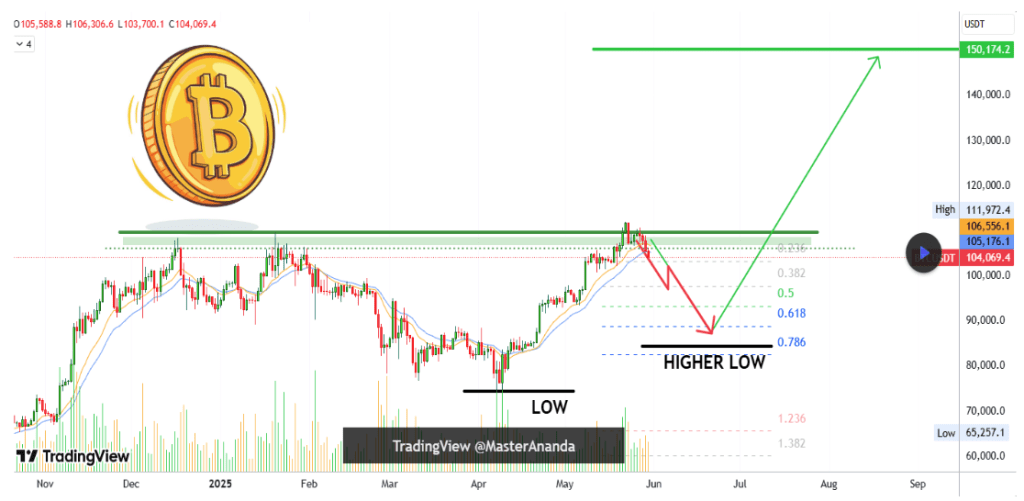
Bitcoin Still Bullish, But $200,000 Off The Table And $137,000 In Sight
Bitcoin’s price action has drawn a sharp dividing line between long-term bullish expectations and sh...
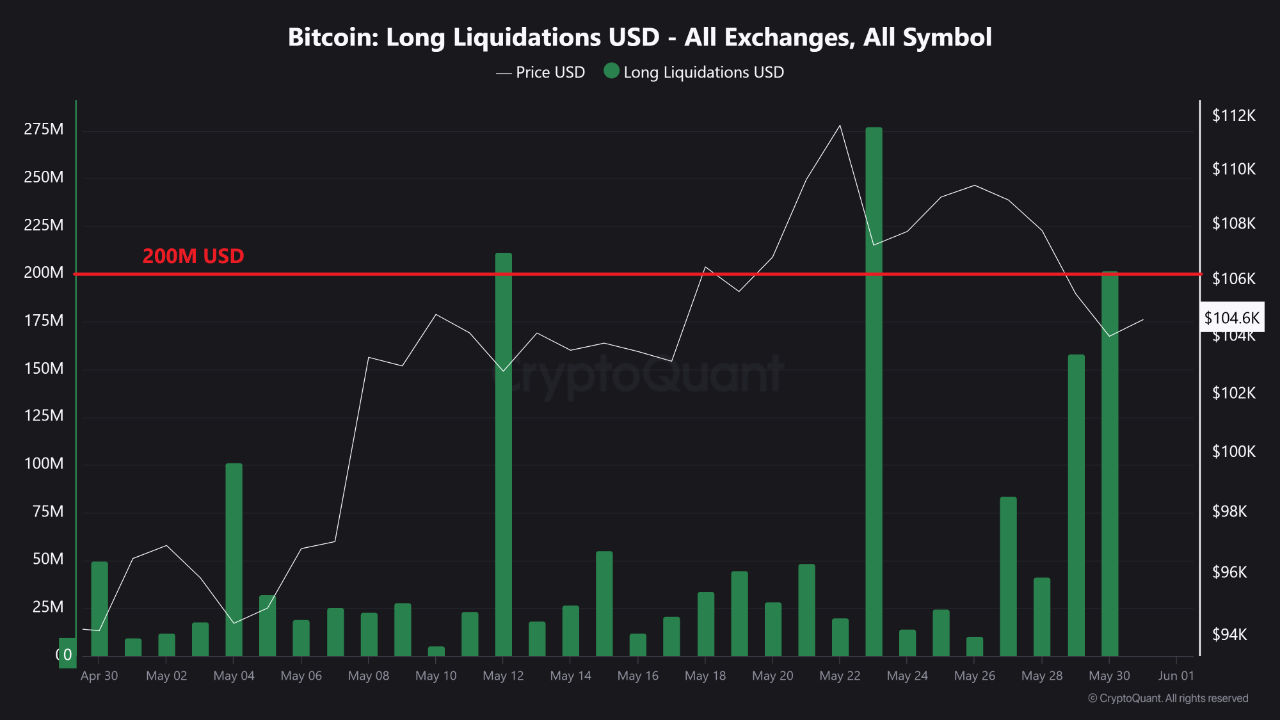
$202 Million In Long Liquidations Rock Bitcoin Market — What’s Next For BTC Price?
Over the weekend, Bitcoin’s price extended its disappointing performance, falling to around $103,000...