XRP Price Clings to Support — Recovery Hopes Hinge on Holding the Line


XRP price started a fresh decline below the $2.150 zone. The price is now consolidating losses and might recover unless the bears push it below $2.120.
- XRP price started a fresh decline below the $2.180 zone.
- The price is now trading below $2.20 and the 100-hourly Simple Moving Average.
- There was a break above a bearish trend line with resistance at $2.1550 on the hourly chart of the XRP/USD pair (data source from Kraken).
- The pair might start a recovery wave if there is a close above the $2.20 resistance zone.
XRP Price Holds Support
XRP price reacted to the downside below the $2.220 support zone, like Bitcoin and Ethereum . The price declined below the $2.20 and $2.180 support levels.
The pair tested the $2.120 support A low was formed at $2.120 and the price is now consolidating losses. There was a minor move above the 23.6% Fib retracement level of the recent decline from the $2.335 swing high to the $2.120 low.
Besides, there was a break above a bearish trend line with resistance at $2.1550 on the hourly chart of the XRP/USD pair. The price is now trading below $2.20 and the 100-hourly Simple Moving Average.
On the upside, the price might face resistance near the $2.180 level. The first major resistance is near the $2.20 level. The next resistance is $2.2250 or the 50% Fib retracement level of the recent decline from the $2.335 swing high to the $2.120 low.
A clear move above the $2.2250 resistance might send the price toward the $2.2540 resistance. Any more gains might send the price toward the $2.280 resistance or even $2.30 in the near term. The next major hurdle for the bulls might be $2.350.
Another Decline?
If XRP fails to clear the $2.20 resistance zone, it could start another decline. Initial support on the downside is near the $2.1420 level. The next major support is near the $2.120 level.
If there is a downside break and a close below the $2.120 level, the price might continue to decline toward the $2.050 support. The next major support sits near the $2.020 zone.
Technical Indicators
Hourly MACD – The MACD for XRP/USD is now losing pace in the bearish zone.
Hourly RSI (Relative Strength Index) – The RSI for XRP/USD is now near the 50 level.
Major Support Levels – $2.1420 and $2.120.
Major Resistance Levels – $2.180 and $2.20.
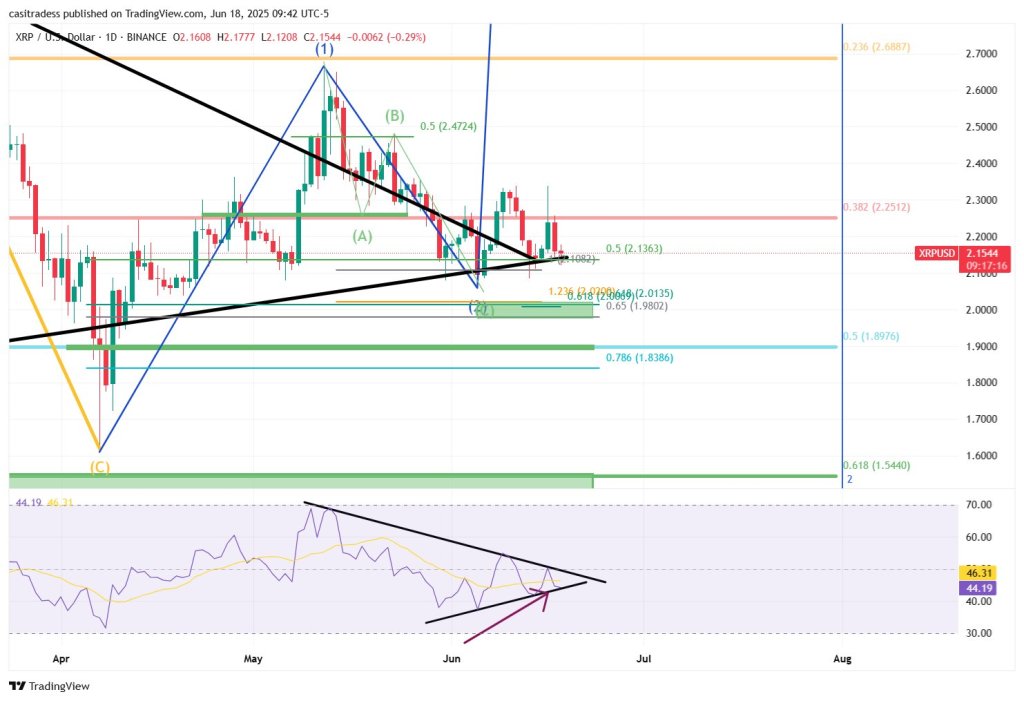
‘Out of Time’: XRP Consolidation Hits Final Moment, Analyst Alerts
In a post late Wednesday, independent technician CasiTrades—followed by 20,000 accounts on the platf...

Worries Over Bitcoin Treasuries Grow — Can Solaxy 100x as First-Ever Solana Layer-2?
Corporate treasury strategies are entering a new era as traditional finance and crypto converge. Two...
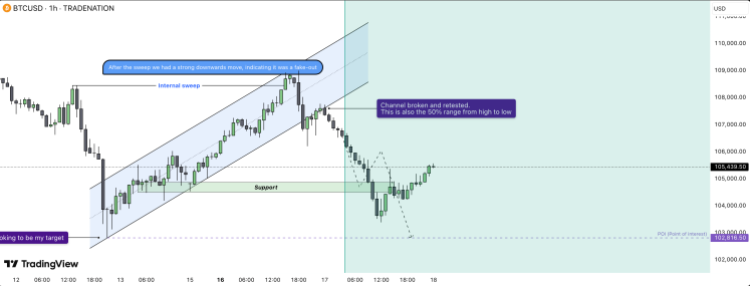
Bitcoin Channel Break Below $105,000 Sparks Panic, Analysts Predict Further Crashes
Bitcoin has been crashing with the advent of the new week, spurred on by uncertainties that surround...