XRP Price Surges, Then Cools — Will Bulls Return for Round Two?


XRP price started a steady increase above the $2.220 zone. The price is now correcting gains and might find bids near the $2.20 zone.
- XRP price started a fresh increase above the $2.220 zone.
- The price is now trading above $2.180 and the 100-hourly Simple Moving Average.
- There is a key bullish trend line forming with support at $2.20 on the hourly chart of the XRP/USD pair (data source from Kraken).
- The pair could gain bullish momentum if it clears the $2.280 resistance zone.
XRP Price Regains Traction
XRP price formed a base above the $2.120 level and started a fresh increase, beating Bitcoin and Ethereum . The price was able to climb above the $2.180 and $2.20 resistance levels.
The pair even surged above the $2.30 level. A high was formed at $2.327 and the price is now correcting gains. There was a move below the $2.280 level. It dipped below the 50% Fib retracement level of the upward move from the $2.165 swing low to the $2.327 high.
The price is now trading above $2.180 and the 100-hourly Simple Moving Average. Besides, there is a key bullish trend line forming with support at $2.20 on the hourly chart of the XRP/USD pair. It is close to the 76.4% Fib retracement level of the upward move from the $2.165 swing low to the $2.327 high.
On the upside, the price might face resistance near the $2.280 level. The first major resistance is near the $2.30 level. The next resistance is $2.320. A clear move above the $2.320 resistance might send the price toward the $2.350 resistance.
Any more gains might send the price toward the $2.40 resistance or even $2.450 in the near term. The next major hurdle for the bulls might be $2.50.
Fresh Decline?
If XRP fails to clear the $2.280 resistance zone, it could start another decline. Initial support on the downside is near the $2.220 level. The next major support is near the $2.20 level.
If there is a downside break and a close below the $2.20 level, the price might continue to decline toward the $2.150 support. The next major support sits near the $2.120 zone.
Technical Indicators
Hourly MACD – The MACD for XRP/USD is now losing pace in the bullish zone.
Hourly RSI (Relative Strength Index) – The RSI for XRP/USD is now above the 50 level.
Major Support Levels – $2.220 and $2.20.
Major Resistance Levels – $2.280 and $2.320.

BitMine Stock Soars 700% After $250 Million Raise For Ethereum Treasury
Tom Lee, the market strategist known for his insightful predictions on Bitcoin (BTC) and broader cry...
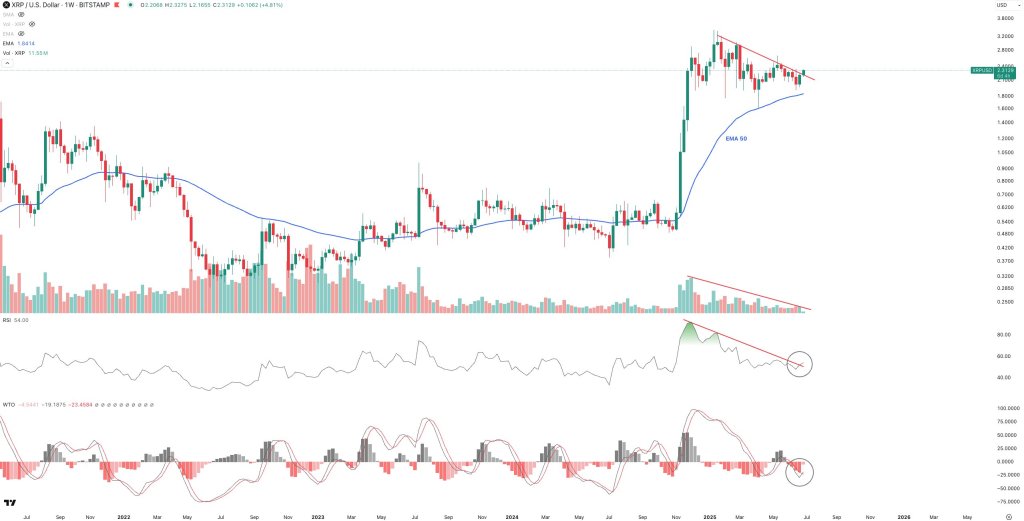
XRP Breaks Out Across The Board—But One Thing’s Missing
XRP has slipped the leash that has restrained it since the mid-January peak at $3.40, with the lates...
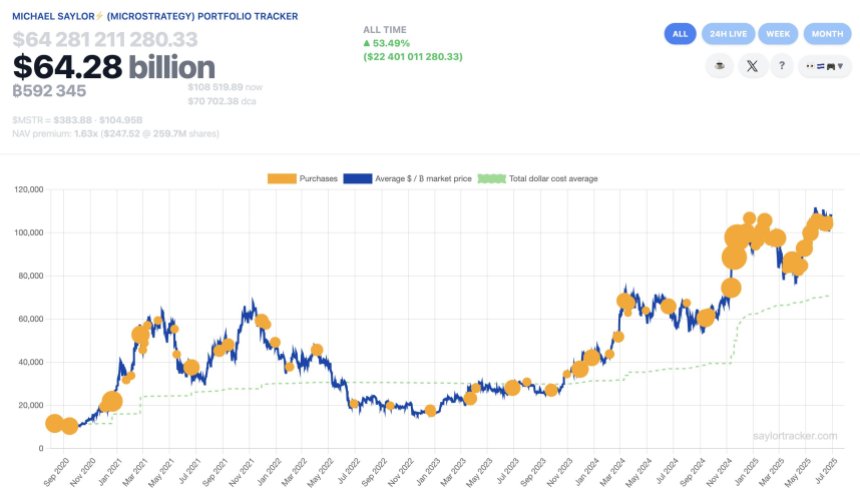
Bitcoin Shopping Spree: Strategy Continues Accumulation With $530M Purchase
Strategy (previously MicroStrategy), the leading corporate holder of Bitcoin (BTC), is on the verge ...