Bitcoin Latest Rally Backed By Stronger Purchasing Power: Report


Data of the Bitcoin Stablecoin Supply Ratio suggests investors have stronger purchasing power today than during the previous bull rally.
Bitcoin Stablecoin Supply Ratio Showing Neutral Purchasing Power
In its latest weekly report, the on-chain analytics firm Glassnode has talked about the latest trend in the Stablecoin Supply Ratio (SSR) of Bitcoin. This indicator measures the ratio between the Bitcoin supply and the supply of stablecoins .
Stablecoins are cryptocurrencies that have their price tied to a fiat currency. The SSR specifically measures the supply of the stablecoins tied to the US Dollar (USD). As for the role that these assets play in the sector, Glassnode explains:
Stablecoins have become a critical component of the digital asset ecosystem, serving as the primary quote asset for trading across both centralized and decentralized venues. Functionally, they represent readily available capital, or “dry powder”, available for digital asset purchases.
As such, the SSR compares the Bitcoin supply against this available dry powder. In other words, it tells us about how the cryptocurrency compares against the investor’s purchasing power.
When the value of the metric is high, it means the BTC supply is high compared to the stablecoin supply. In other words, the trader’s purchasing power is weak. On the other hand, the indicator being low suggests there is high dry powder available relative to the BTC supply.
In the context of the current discussion, the SSR itself isn’t of focus, but rather a modified indicator called the SSR Oscillator. According to the analytics firm, the metric measures “how the 200d SMA of the SSR moves within the Bollinger Bands BB(200, 2).”
Now, here is a chart that shows the trend in the Bitcoin SSR Oscillator over the last few years:

As displayed in the above graph, the Bitcoin SSR Oscillator has been close to the zero mark during the last couple of months, indicating the investor purchasing power is more or less neutral compared to the size of the BTC supply.
From the chart, it’s visible that the trend was different during the rally beyond $100,000 that occurred late last year. Back then, the SSR Oscillator took on a highly positive value, suggesting the stablecoin supply was low relative to BTC.
The cryptocurrency is currently also trading around the same levels as then, yet the SSR is showing a different story. “Despite similar price levels, this shift suggests that investor purchasing power has improved markedly, reflecting stronger underlying demand conditions,” notes the report.
BTC Price
At the time of writing, Bitcoin is trading around $109,500, up over 2% in the last seven days.

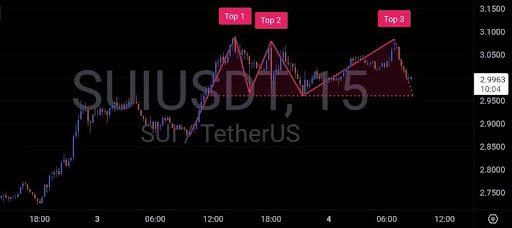
SUI Prints Classic Reversal Setup With Triple Top Formation
SUI has recently exhibited a classic reversal pattern, forming a well-defined triple-top formation o...
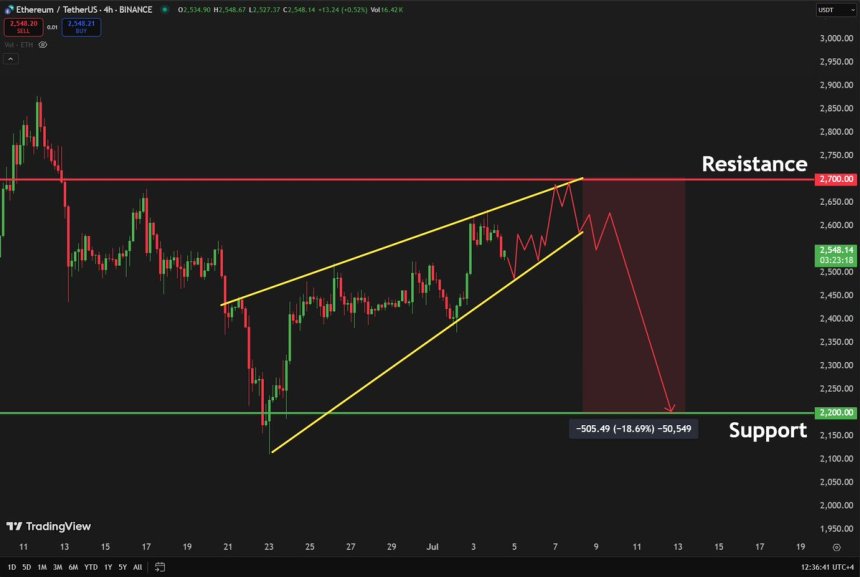
Ethereum Forms Rising Wedge Pattern – $2,200 Support Back In Focus?
Ethereum is trading above the $2,500 mark but continues to struggle with strong resistance near $2,6...
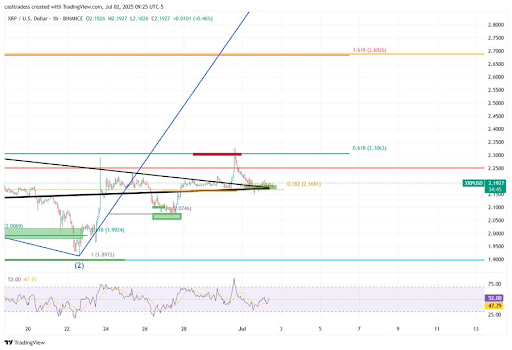
XRP’s 30% Jump To $2.8: Analyst Says This ‘Classic Confirmation’ Must Happen First
Crypto analyst CasiTrades has predicted that the XRP price could record a 30% rally to $2.8. She fur...