Breakout or Breakdown? XRP $2.35 Test Could Decide Its Next Move


XRP is showing mixed signals across timeframes, leaving traders on edge as the price approaches the key $2.35 level. While a recent breakout from a falling wedge on the 3-day chart suggests a bullish reversal, the 4-hour chart reveals signs of slowing momentum and a possible rising wedge. With buyers and sellers locked in a battle, $2.35 could be the tipping point that decides whether XRP surges higher or slips into a near-term correction .
XRP Breaks Out Of Falling Wedge On 3-Day Chart
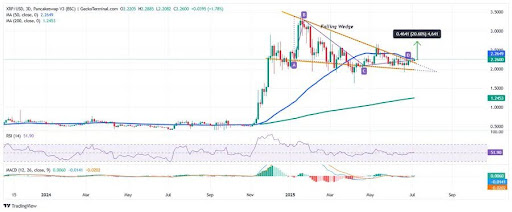
In an X post , LSplayQ highlighted a key technical development on the XRP 3-day price chart, pointing to a breakout from a falling wedge pattern. This type of pattern is commonly associated with bullish reversals, signaling that market sentiment may be shifting in favor of the bulls.
Following the breakout , XRP is currently trading around $2.26, and according to LSplayQ, the move suggests that buyers are stepping back in to reclaim control. The price action marks a significant shift after an extended period of downward compression within the wedge. If the bullish momentum continues, LSplayQ notes that XRP could target a breakout level near $2.72, which represents an upside potential of roughly 20% from the current price.

That said, LSplayQ also warns of the risk of a pullback if XRP fails to hold above the wedge breakout level. In such a scenario, the price could retest the $2.10 zone as a potential support. Overall, the technical outlook leans bullish, as long as XRP maintains its position above the breakout level.
Rising Wedge Pattern Signals Caution Ahead
In a post on X, The Crypto Bushman pointed out that XRP is pushing higher on the 4-hour chart, but warned that seasoned traders are keeping a close eye on what lies beneath the surface.
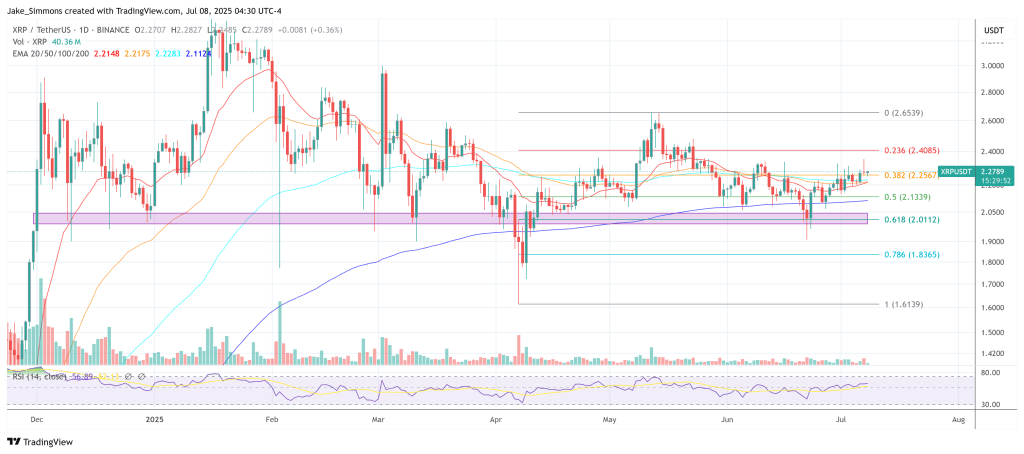
According to the analyst, the price is currently trading above both the 20- and 50-day EMAs, which typically signals short-term strength. However, the overall structure appears to be forming a rising wedge, a pattern often linked to potential reversals. At the same time, momentum is beginning to fade, with the MACD flattening and volume tapering off, which Bushman describes as classic signs of a potential trap move.
The Crypto Bushman emphasized that a failure to break cleanly above $2.35 could lead to the setup rolling over. In that case, the $2.25 zone becomes a critical level to watch for a possible breakdown and shift in sentiment. On the flip side, a strong breakout backed by volume could fuel another leg up toward $2.50 if buying pressure returns decisively.


Bitcoin Price Crash To $92,000 Or New ATHs? Analyst Explains The 2 Options
Bitcoin’s recent price action is holding firm above the $108,000 level despite a string of minor pul...

PEPE Traders Spot Breakout Echo—Explosive Surge Back On The Table?
Based on reports from the trading account Bitcoinensus on X, PEPE has formed a pattern that led to a...

Pundit Explains Why XRP Stands To Gain Big From Ripple’s RLUSD
Ripple’s dollar-pegged stablecoin, Ripple USD (RLUSD), has spent the past six months quietly becomin...

