Bitcoin Breakout Alert — Price Turns Green as Bulls Step In


Bitcoin price started a fresh increase above the $108,500 zone. BTC is now up over 3% and showing positive signs above the $110,000 level.
- Bitcoin started a fresh increase above the $108,500 zone.
- The price is trading above $110,500 and the 100 hourly Simple moving average.
- There was a break above a bearish trend line with resistance at $108,800 on the hourly chart of the BTC/USD pair (data feed from Kraken).
- The pair could continue to rise if it clears the $112,000 resistance zone.
Bitcoin Price Eyes More Gains
Bitcoin price started a fresh increase after it cleared the $108,500 resistance zone . BTC gained pace for a move above the $108,800 and $109,500 resistance.
Besides, there was a break above a bearish trend line with resistance at $108,800 on the hourly chart of the BTC/USD pair. The bulls even pumped the pair above the $110,000 resistance zone. It opened the doors for a move toward the $112,000 level.
A high was formed at $112,000 and the price is now consolidating gains . It tested the 23.6% Fib retracement level of the upward move from the $107,500 swing low to the $112,000 high.
Bitcoin is now trading above $109,500 and the 100 hourly Simple moving average. Immediate resistance on the upside is near the $111,600 level. The first key resistance is near the $112,000 level. The next resistance could be $112,500.
A close above the $112,500 resistance might send the price further higher. In the stated case, the price could rise and test the $115,000 resistance level. Any more gains might send the price toward the $116,000 level. The main target could be $118,000.
Downside Correction In BTC?
If Bitcoin fails to rise above the $112,000 resistance zone, it could start a downside correction. Immediate support is near the $110,800 level. The first major support is near the $109,750 level or the 50% Fib retracement level of the upward move from the $107,500 swing low to the $112,000 high.
The next support is now near the $109,200 zone. Any more losses might send the price toward the $108,500 support in the near term. The main support sits at $107,500, below which BTC might continue to move down.
Technical indicators:
Hourly MACD – The MACD is now gaining pace in the bullish zone.
Hourly RSI (Relative Strength Index) – The RSI for BTC/USD is now above the 50 level.
Major Support Levels – $110,800, followed by $109,750.
Major Resistance Levels – $112,000 and $115,000.
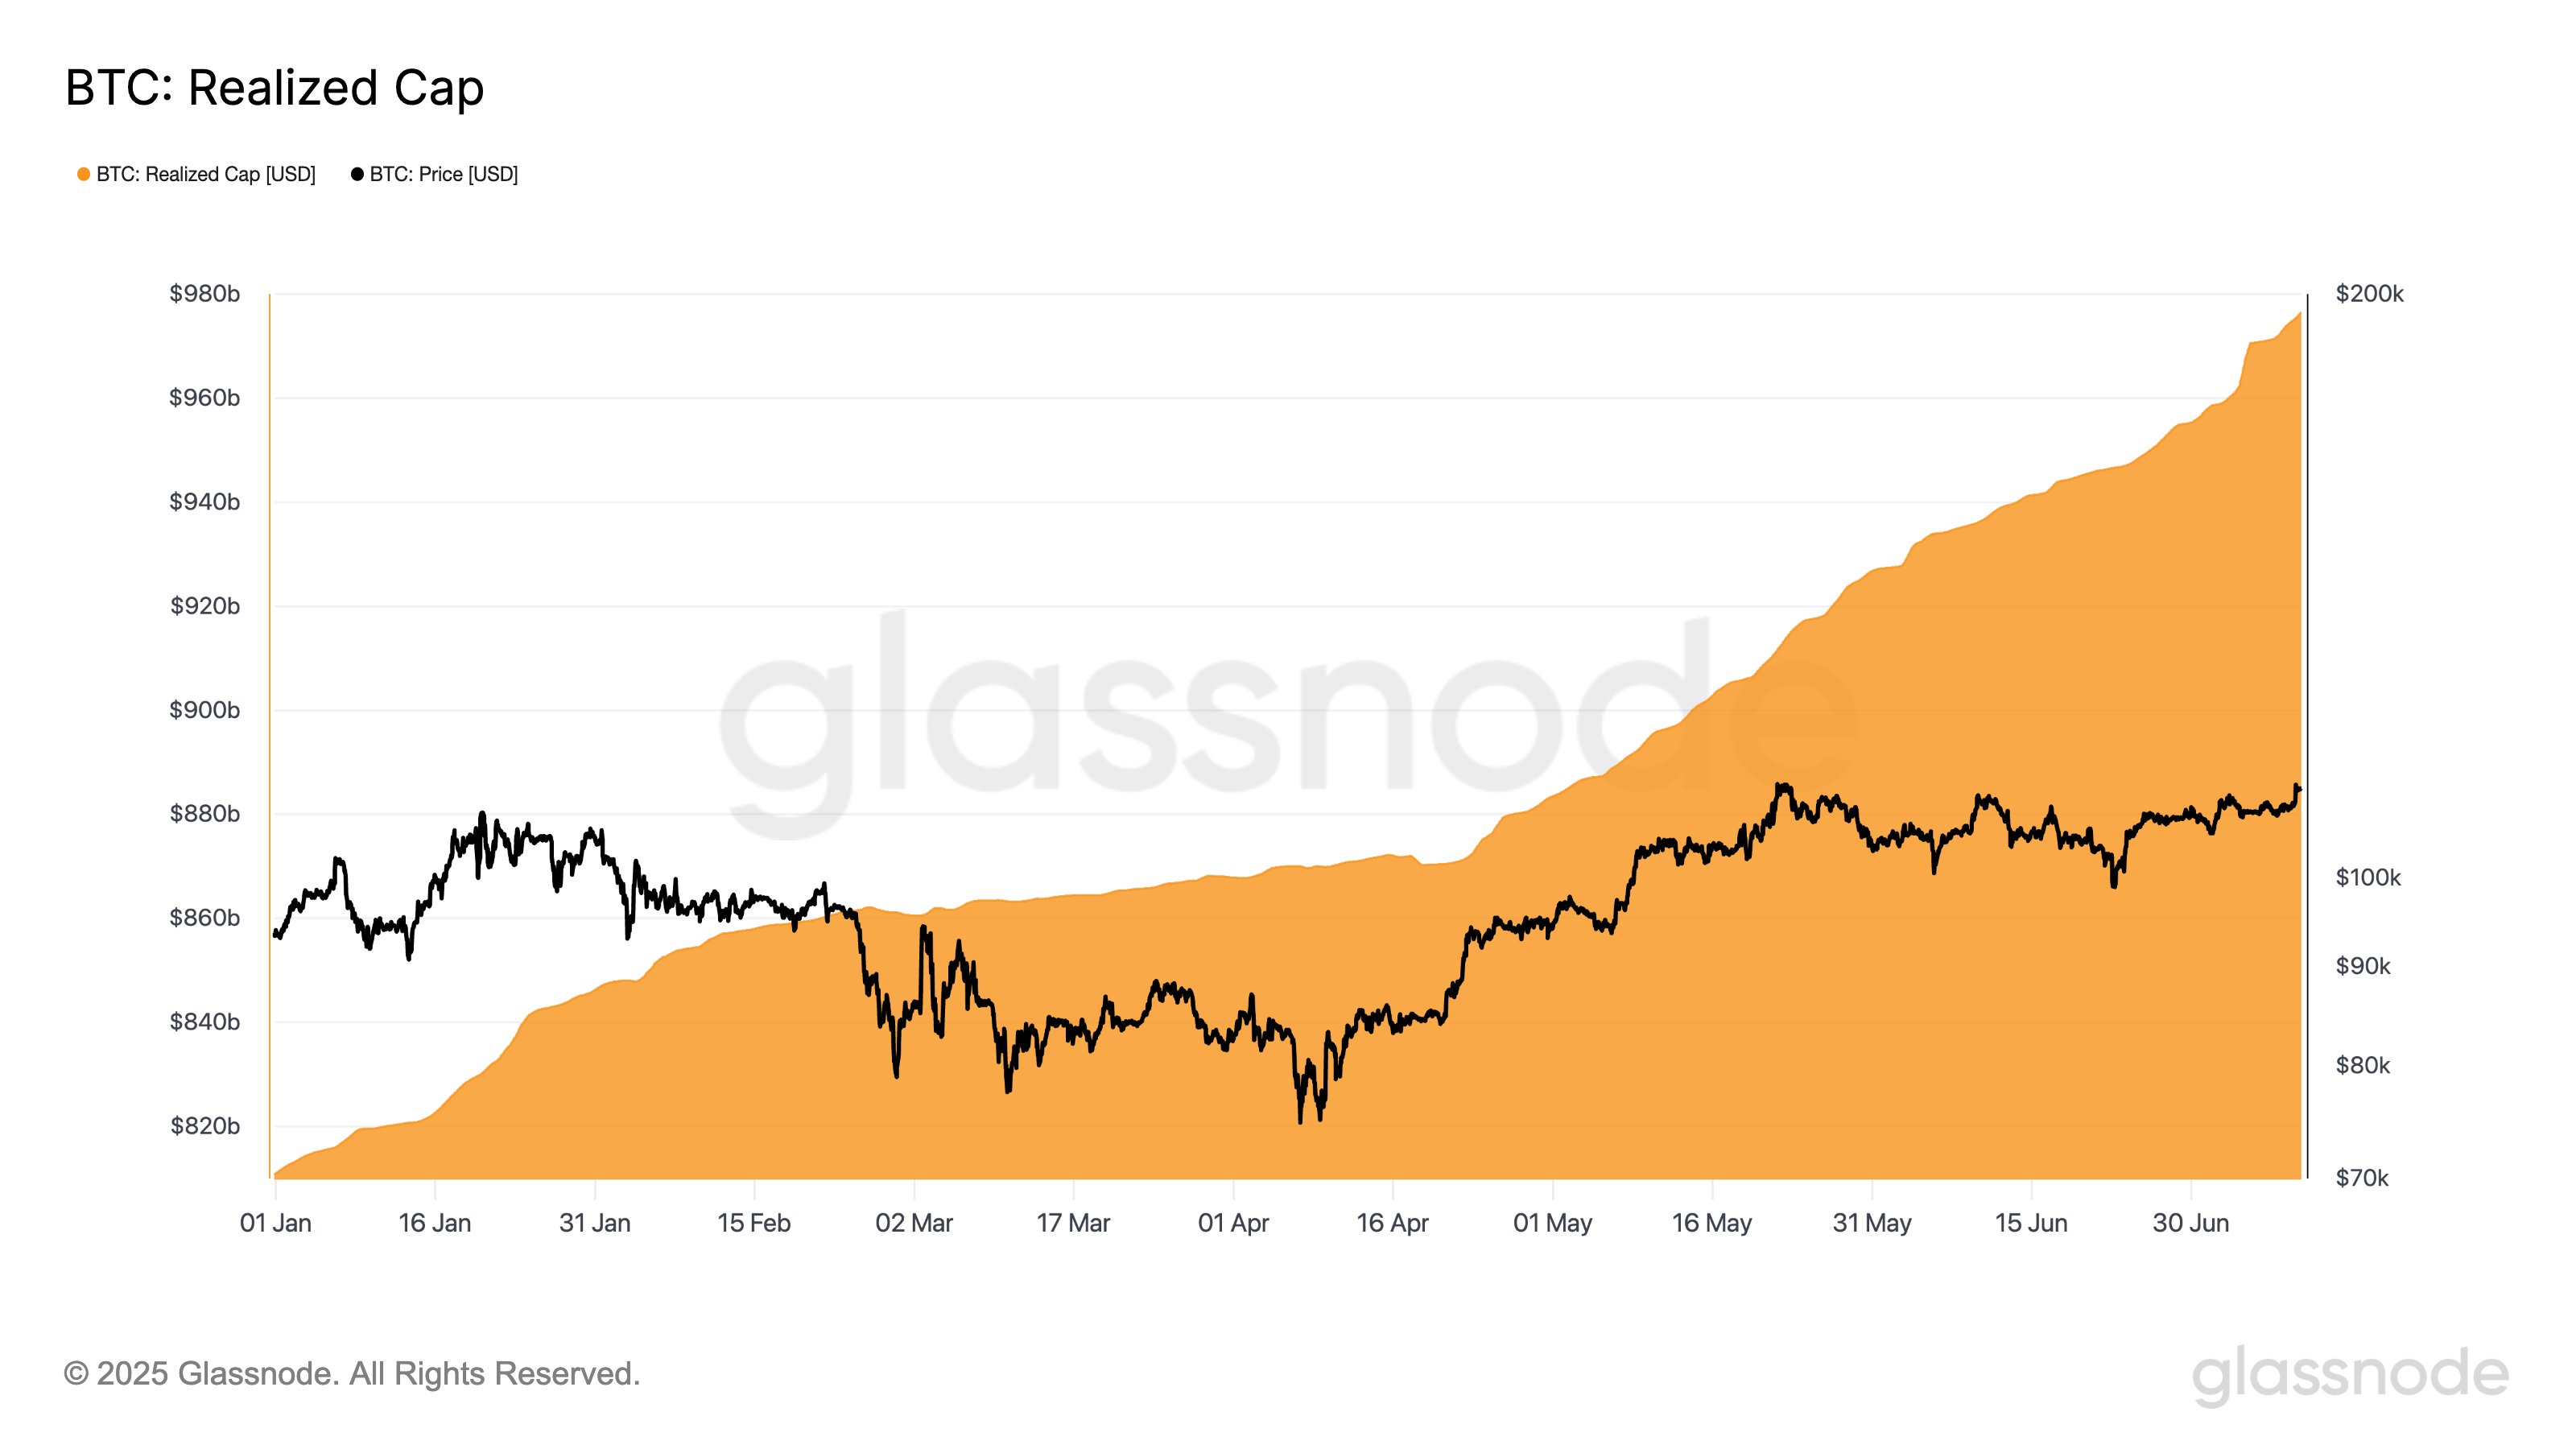
Bitcoin Breakout Not Just Hype—$4.4B Inflows Back The Move
Bitcoin has set a new all-time high (ATH) above $112,000, and if on-chain data is to go by, there is...
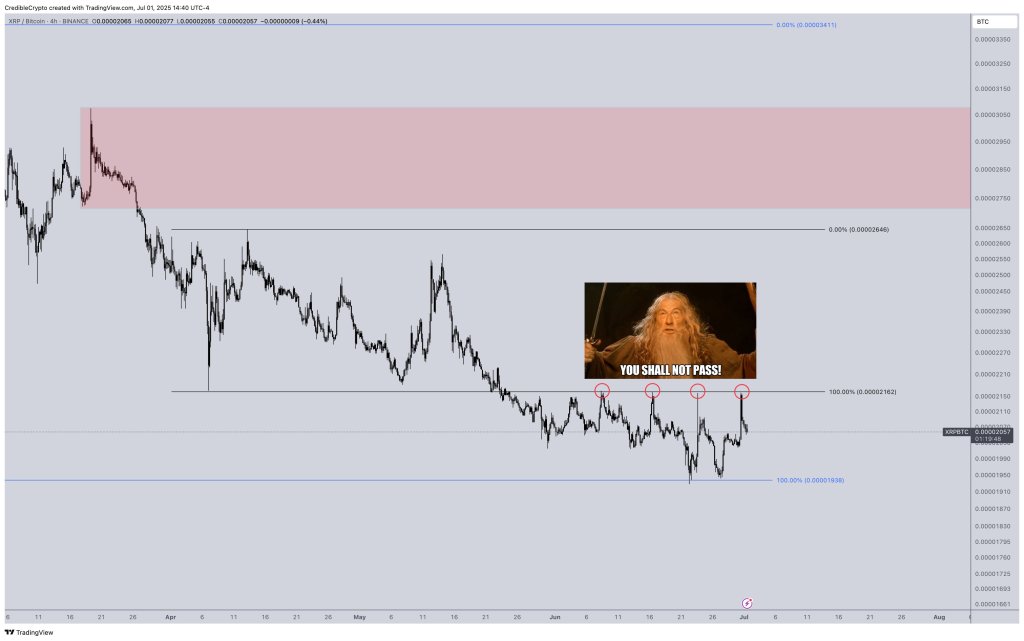
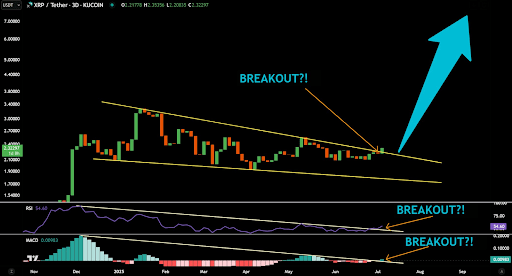
XRP Flashes Signal That Last Time Preceded A 464% Rally, Analyst Says
In a new video released June 9, crypto analyst CryptoInsightUK issued a extremely bullish XRP update...
Analyst Mocks Calls For XRP Price At $1,000, Says Take Profits At This Level
Crypto analyst Jaydee has called out market participants who predict that the XRP price could rally ...