Bitcoin Price Retreats After Hitting ATH — Bulls Pause for Breath


Bitcoin price started a fresh increase above the $118,500 zone. BTC traded to a new high above $120,000 and recently started a downside correction.
- Bitcoin started a fresh increase above the $120,000 zone.
- The price is trading near $118,500 and the 100 hourly Simple moving average.
- There was a break below a bullish trend line with support at $119,800 on the hourly chart of the BTC/USD pair (data feed from Kraken).
- The pair might start another increase if it clears the $120,500 resistance zone.
Bitcoin Price Sets New ATH
Bitcoin price started a fresh increase after it cleared the $116,500 resistance zone . BTC gained pace for a move above the $118,000 and $120,000 resistance.
The bulls even pumped the pair above the $122,000 resistance zone. A new all-time high was formed at $123,140 and the price is now consolidating gains . There was a move below the 23.6% Fib retracement level of the upward move from the $108,636 swing low to the $123,140 high.
Besides, there was a break below a bullish trend line with support at $119,800 on the hourly chart of the BTC/USD pair. Bitcoin is now trading near $118,500 and the 100 hourly Simple moving average.
Immediate resistance on the upside is near the $119,550 level. The first key resistance is near the $120,500 level. The next resistance could be $122,000. A close above the $122,000 resistance might send the price further higher. In the stated case, the price could rise and test the $123,200 resistance level. Any more gains might send the price toward the $125,000 level. The main target could be $130,000.
Downside Correction In BTC?
If Bitcoin fails to rise above the $120,500 resistance zone, it could start a downside correction. Immediate support is near the $117,500 level. The first major support is near the $115,800 level or the 50% Fib retracement level of the upward move from the $108,636 swing low to the $123,140 high.
The next support is now near the $114,000 zone. Any more losses might send the price toward the $112,500 support in the near term. The main support sits at $110,500, below which BTC might continue to move down.
Technical indicators:
Hourly MACD – The MACD is now losing pace in the bullish zone.
Hourly RSI (Relative Strength Index) – The RSI for BTC/USD is now below the 50 level.
Major Support Levels – $117,500, followed by $115,800.
Major Resistance Levels – $120,500 and $122,000.

Coinbase: A Surprising Champion Of The Trump Trade, Eyes New Stock Records
Coinbase (COIN) is experiencing significant momentum, with its stock poised to reach a record closin...
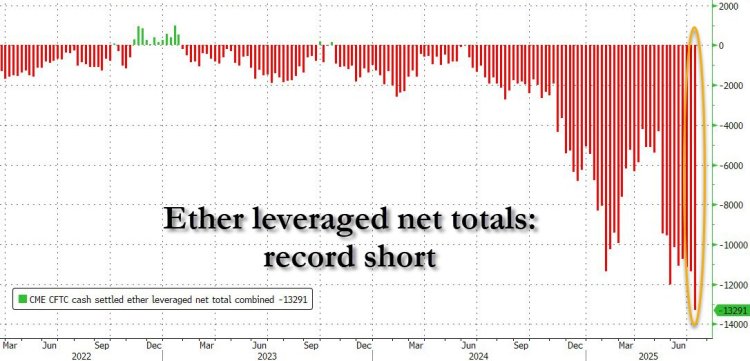
Ethereum Shorts Reach Record Levels, How To Stay Positioned For A Breakout
As the Ethereum price has broken out above $3,000, the shorts have piled on with expectations that t...
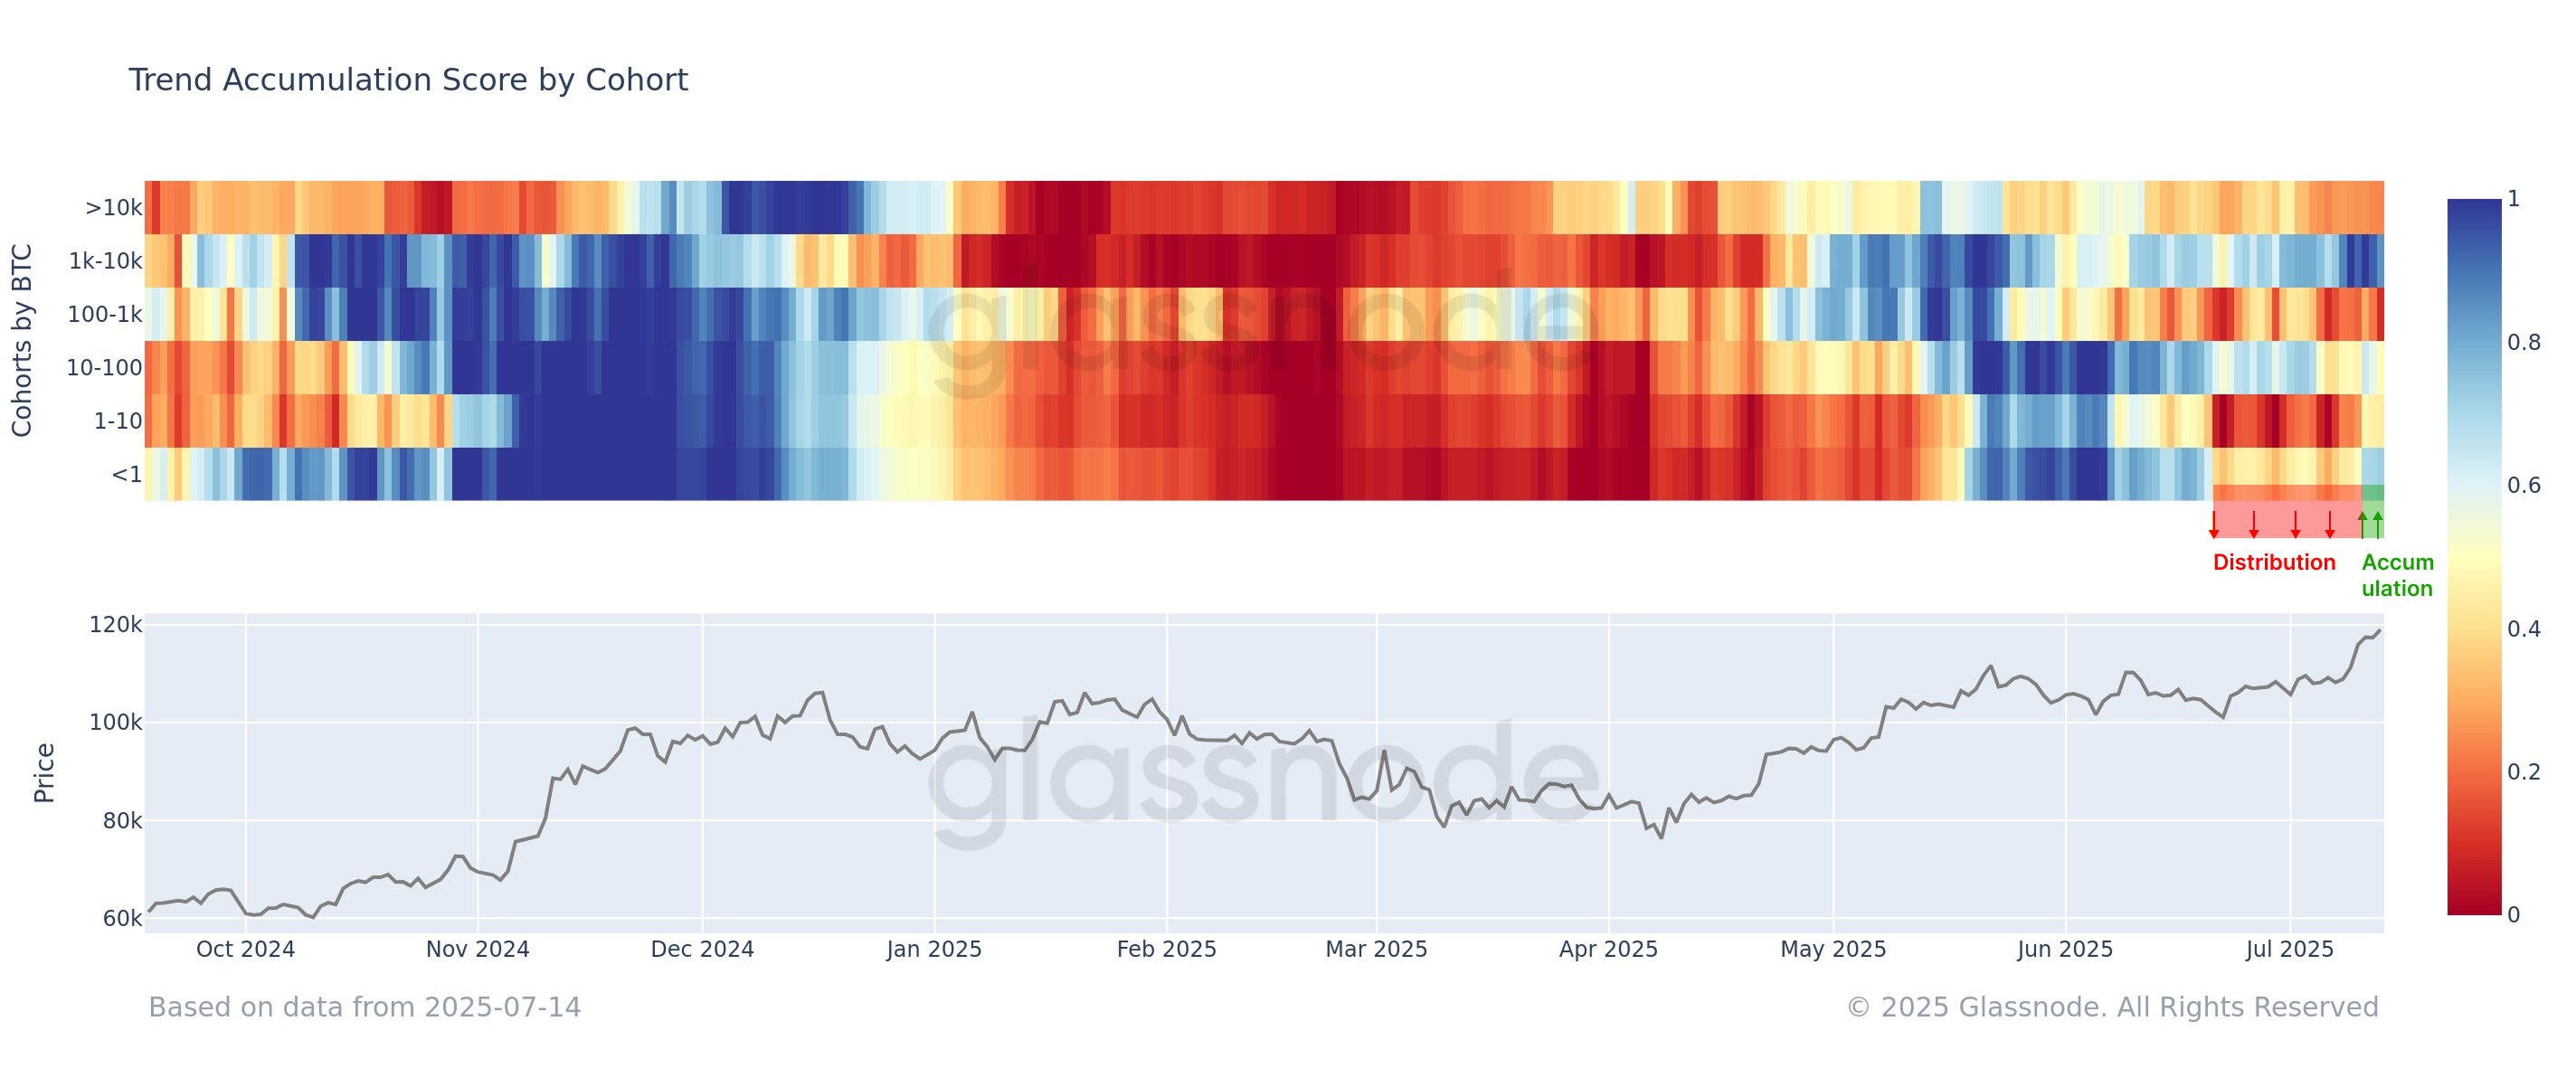
Strategy Grabs Another $472M In Bitcoin—Even With Price At ATH
Bitcoin has been exploring new all-time highs (ATHs) recently, but Strategy still seems to be in acc...