Bitcoin Price Consolidates—Is a Downside Correction on the Horizon?


Bitcoin price is consolidating gains below the $118,000 resistance. BTC could start a downside correction if it breaks the $116,200 support zone.
- Bitcoin started a fresh decline after it failed to clear the $120,000 zone.
- The price is trading below $118,000 and the 100 hourly Simple moving average.
- There is a bearish trend line forming with resistance at $118,000 on the hourly chart of the BTC/USD pair (data feed from Kraken).
- The pair might start another increase if it clears the $120,000 resistance zone.
Bitcoin Price Dips Again
Bitcoin price started a correction after the bulls failed to clear the $120,000 resistance. BTC dipped below the $118,000 level and tested the $116,200 zone.
A low was formed at $116,260 and the price is now attempting a fresh increase. The bulls were above to push the price above the $117,000 resistance level. There was a move toward the 50% Fib retracement level of the downward move from the $119,630 swing high to the $116,260 low.
Bitcoin is now trading below $118,500 and the 100 hourly Simple moving average . Immediate resistance on the upside is near the $118,000 level. There is also a bearish trend line forming with resistance at $118,000 on the hourly chart of the BTC/USD pair.
The first key resistance is near the $118,400 level. It is close to the 61.8% Fib level of the downward move from the $119,630 swing high to the $116,260 low. The next resistance could be $119,150.
A close above the $119,150 resistance might send the price further higher. In the stated case, the price could rise and test the $120,500 resistance level. Any more gains might send the price toward the $122,000 level. The main target could be $123,200.
Another Decline In BTC?
If Bitcoin fails to rise above the $118,400 resistance zone, it could start another decline. Immediate support is near the $116,200 level. The first major support is near the $115,500 level.
The next support is now near the $115,500 zone. Any more losses might send the price toward the $112,500 support in the near term. The main support sits at $111,200, below which BTC might continue to move down.
Technical indicators:
Hourly MACD – The MACD is now gaining pace in the bearish zone.
Hourly RSI (Relative Strength Index) – The RSI for BTC/USD is now below the 50 level.
Major Support Levels – $116,200, followed by $115,500.
Major Resistance Levels – $118,000 and $120,500.
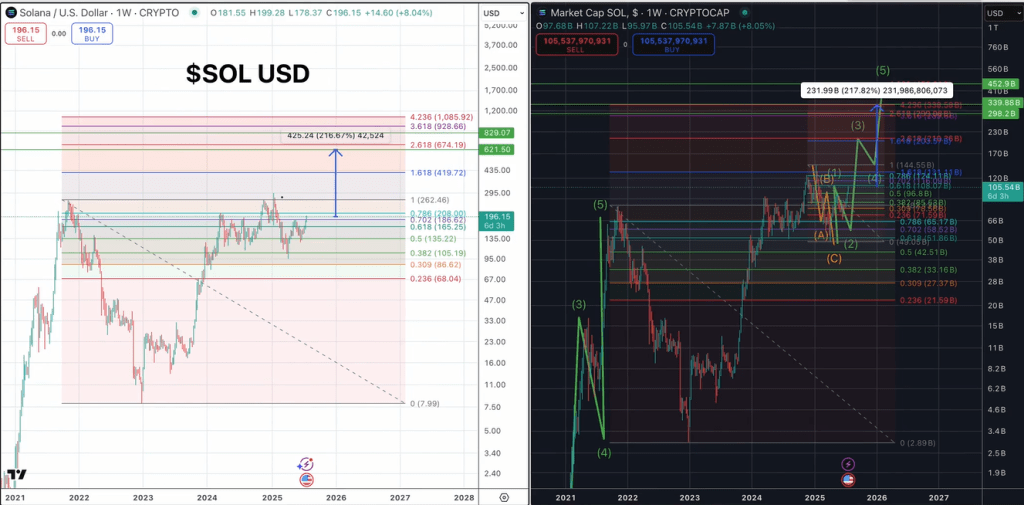
$830 Target For Solana? Analyst Says The Math Checks Out
Solana could be on track for a massive 323% rally this altcoin season, according to a new technical ...

Strategy’s Bitcoin Holdings Surpass 607,000 Tokens Amid Regulatory Progress In The US
Strategy (previously MicroStrategy), the world’s largest corporate holder of Bitcoin (BTC), announce...

Ethereum Fueling The Fire? Crypto Inflows Hit Over $4 Billion In A Week
The global crypto fund world saw another banner week as investors piled in. According to CoinShares ...