Bitcoin Records $2.79B in Net Weekly Taker Selling as Bears Pressure Market


- Bitcoin faces one of the sharpest weekly sell pressures since 2022, totaling $2.79B.
- Price holds at $117K despite aggressive taker volume, showing resilience amid volatility.
- Market focus shifts to spot demand and ETF inflows to counter bearish taker activity.
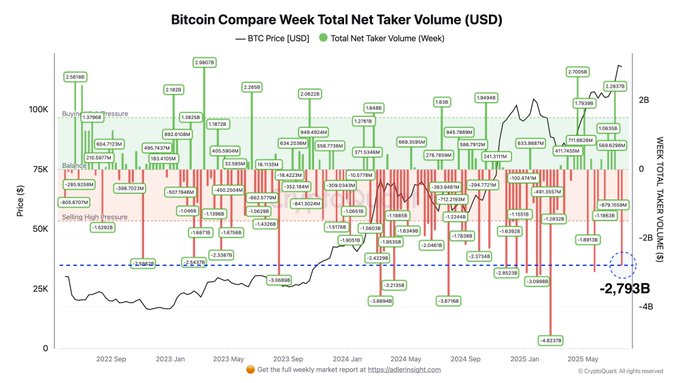
Bitcoin experienced one of its heaviest weeks of market selling in the current bull cycle, with net taker volume dropping into negative territory. On-chain data shows a total weekly net taker volume of approximately $2.79 billion, placing the week among the most extreme sell-side events since 2022. Despite this aggressive sell pressure, Bitcoin’s price has rebounded to around $117,000, showing deeper resilience in the face of heightened volatility.
The taker volume metric, which measures the net balance of market-order (taker) buy and sell activity, turned negative over the past week. The large red histogram bar recorded on the Bitcoin Compare Week Total Net Taker Volume chart signals dominant sell-side activity, with sellers showing greater urgency than buyers in crossing the bid-ask spread.
This week’s taker data is one of 12 instances in the current bull cycle to display such high or higher bearish volume, representing approximately 7.3% of total weekly sessions during this period. The chart covering 2022 to 2025 shows a of similar or deeper drawdowns in net taker flows, many of which coincided with local price corrections or temporary market breakdowns.
Price Consolidation Follows Aggressive Sell-Side Volume
During the same period, Bitcoin prices held within the $60,000–$70,000 range. Although price stability has returned at $117,000, historical patterns indicate that extreme negative net taker prints have occurred during previous volatility events. In some cases, these were followed by price rebounds; in others, they preceded further declines.
The net taker flow’s sharp drop captures market pressure but does not directly forecast directional outcomes. The ongoing series of red bars through 2024 and 2025 suggests repeated episodes of aggressive selling, often occurring when bullish momentum weakens.

Notably, positive taker volumes during the same two-year period have exceeded a few billion dollars in net buying. This contrast highlights an asymmetry in market behavior, where sell-side activity often outweighs bullish market orders, even during upward price trends.
Focus Shifts to Spot Demand Absorption and ETF Activity
Once the latest negative taker print has consolidated, the question will be whether demand in the spot market, either in the form of limit orders or ETF inflows , will be sufficient to cover the sell-side volume. Market observers are paying attention to whether the taker flows are getting back to neutral or increasing, which may thus mean resumed interest from aggressive buyers.
Such a shift has yet to be seen, and sentiment is thus reactive, with sellers moving the short-term trend. The net print of $2.79 billion points out to a warning whistle all around with the tone being set by market participants in line to the next round in the trading cycles.

xUSD Has Landed on Equilibria with 250% vePENDLE Boost
Equilibria has integrated xUSD with a 250% vePENDLE boost for enhanced DeFi yields, smart vault stra...

XRP Positioned as Possible ‘World’s Reserve Bridge Currency’ Amid Global Payment Growth
$XRP rises 4% to $3.18 as Oliver Michel calls it a “World’s Reserve Bridge Currency,” while Wellgist...

AI-Driven Crypto Projects Skyrocket on Social Media, $TAO, $INJ, and $FET Lead
As per the data from Phoenix Group, $TAO, $INJ, and $FET are the top AI-centered crypto projects bas...


 Adler Jr (@AxelAdlerJr)