Solana (SOL) Jumps Higher Again, Can Bulls Hold Their Ground?


Solana started a fresh increase from the $175 zone. SOL price is now recovering higher and might aim for a move above the $188 resistance zone.
- SOL price started a recovery wave after it tested the $175 zone against the US Dollar.
- The price is now trading above $182 and the 100-hourly simple moving average.
- There was a break above a connecting bearish trend line with resistance at $183 on the hourly chart of the SOL/USD pair (data source from Kraken).
- The pair could start a fresh increase if it clears the $188 resistance zone.
Solana Price Eyes Steady Increase
Solana price extended losses after there was a close below $188, like Bitcoin and Ethereum . SOL traded below the $185 and $108 support levels to enter a short-term bearish zone.
A low was formed at $175 and the price is now attempting a fresh increase. The price surpassed the $180 and $182 resistance levels. There was a move above the 23.6% Fib retracement level of the downward move from the $210 swing high to the $175 low.
Besides, there was a break above a connecting bearish trend line with resistance at $183 on the hourly chart of the SOL/USD pair. Solana is now trading above $182 and the 100-hourly simple moving average.
On the upside, the price is facing resistance near the $188 level. The next major resistance is near the $192 level or the 50% Fib retracement level of the downward move from the $210 swing high to the $175 low. The main resistance could be $195. A successful close above the $195 resistance zone could set the pace for another steady increase. The next key resistance is $200. Any more gains might send the price toward the $210 level.
Another Decline In SOL?
If SOL fails to rise above the $188 resistance, it could continue to move down. Initial support on the downside is near the $184 zone. The first major support is near the $180 level.
A break below the $180 level might send the price toward the $175 support zone. If there is a close below the $175 support, the price could decline toward the $166 support in the near term.
Technical Indicators
Hourly MACD – The MACD for SOL/USD is gaining pace in the bullish zone.
Hourly Hours RSI (Relative Strength Index) – The RSI for SOL/USD is above the 50 level.
Major Support Levels – $180 and $175.
Major Resistance Levels – $188 and $192.
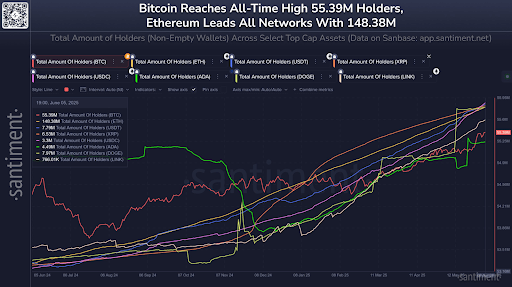
Dogecoin Holder Count Surges Toward New All-Time Highs — Here Are The Figures
Dogecoin, despite being held up around the $0.21 to $0.23 price zone, has seen its user base grow wi...

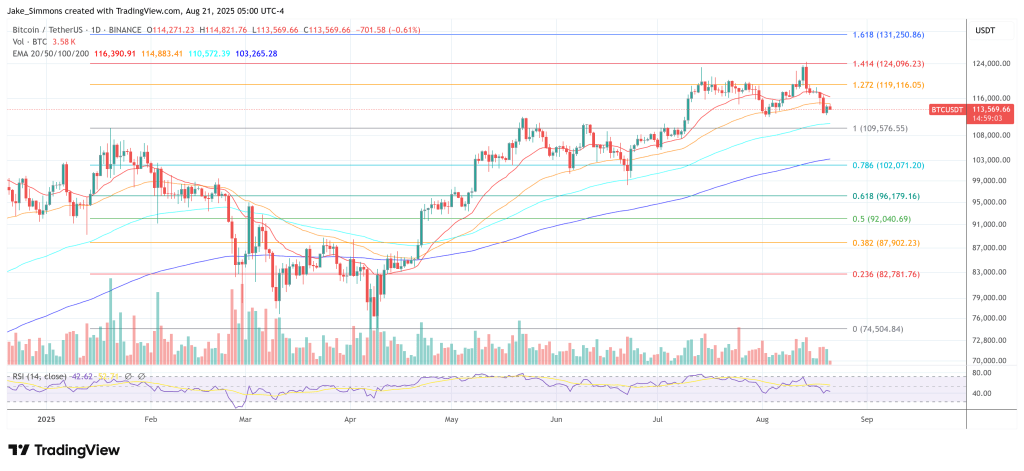
Analyst Sounds The Alarm—Bitcoin Could Slide Toward $88K
Bitcoin’s recovery attempt is drawing attention after a week of steady losses, with one market watch...
Bitcoin To $15 Million Possible Once Powell Is Out, Says Arthur Hayes
Arthur Hayes believes the long arc of US policy now points toward money creation on a scale that cou...