BNB Price Surges to Fresh ATH – Can Bulls Push Toward $1K?


BNB price is gaining pace above the $885 zone. The price is now showing positive signs and might aim for a move above the $920 level in the near term.
- BNB price started a fresh increase above the $880 and $900 levels.
- The price is now trading above $900 and the 100-hourly simple moving average.
- There is a key bullish trend line forming with support at $898 on the hourly chart of the BNB/USD pair (data source from Binance).
- The pair must stay above the $885 level to start another increase in the near term.
BNB Price Extends Gains
BNB price formed a base above the $850 level and started a fresh increase, beating Ethereum and Bitcoin . There was a steady move above the $870 and $885 levels.
The bulls even cleared the $895 resistance zone. A new all-time high was formed at $908 and the price is now consolidating gains. It is trading near the 23.6% Fib retracement level of the upward move from the $888 swing low to the $908 high.
The price is now trading above $900 and the 100-hourly simple moving average. Besides, there is a key bullish trend line forming with support at $898 on the hourly chart of the BNB/USD pair.
On the upside, the price could face resistance near the $908 level. The next resistance sits near the $912 level. A clear move above the $912 zone could send the price higher. In the stated case, BNB price could test $920. A close above the $920 resistance might set the pace for a larger move toward the $945 resistance. Any more gains might call for a test of the $1,000 handle in the near term.
Short-Term Pullback?
If BNB fails to clear the $908 resistance, it could start another decline. Initial support on the downside is near the $898 level. The next major support is near the $893 level or the 76.4% Fib retracement level of the upward move from the $888 swing low to the $908 high.
The main support sits at $888. If there is a downside break below the $888 support, the price could drop toward the $872 support. Any more losses could initiate a larger decline toward the $865 level.
Technical Indicators
Hourly MACD – The MACD for BNB/USD is gaining pace in the bullish zone.
Hourly RSI (Relative Strength Index) – The RSI for BNB/USD is currently above the 50 level.
Major Support Levels – $898 and $888.
Major Resistance Levels – $908 and $920.
Crypto Faces Liquidity Endgame—Debt And Inflation Risks Mount By 2026
Raoul Pal’s latest “Journey Man” episode brings back Michael Howell, CEO of CrossBorder Capital, for...
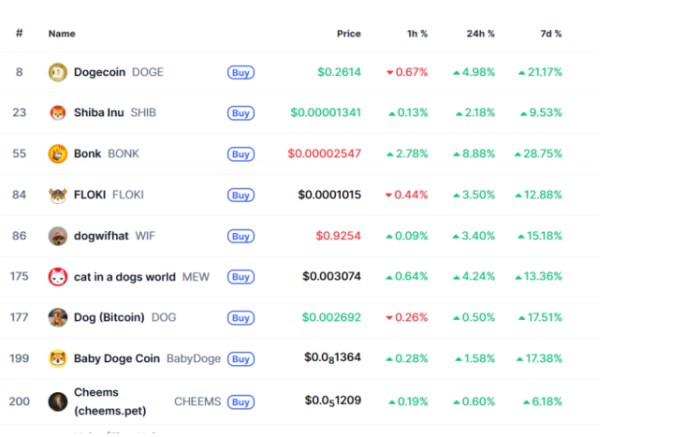
Dogecoin Up 20% as CleanCore Buys $125M in DOGE —Maxi Doge Could Explode Next
Dogecoin has been steadily rallying, increasing nearly 20% to about $0.25, after a large purchase fr...
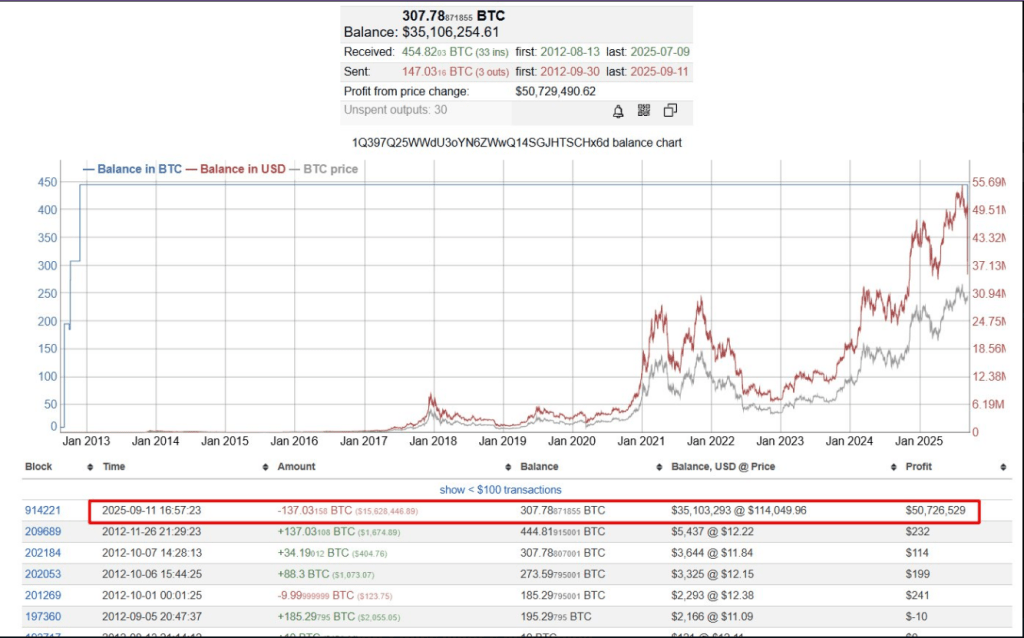
$15M In Bitcoin Awakens From 10-Year Slumber As BTC Hits $116K
Bitcoin is back in the spotlight after reports confirmed that coins untouched since 2012 have been m...