Solana (SOL) Moves Higher – Bulls Target Next Big Level as Volume Builds


Solana started a fresh increase above the $245 zone. SOL price is now correcting some gains and might find bids near $242 or $240.
- SOL price started a fresh upward move above the $242 and $245 levels against the US Dollar.
- The price is now trading above $240 and the 100-hourly simple moving average.
- There was a break above a key bearish trend line with resistance at $240 on the hourly chart of the SOL/USD pair (data source from Kraken).
- The pair could extend losses if it dips below the $240 zone.
Solana Price Corrects Some Gains
Solana price started a decent increase after it settled above the $232 zone, beating Bitcoin and Ethereum . SOL climbed above the $240 level to enter a short-term positive zone.
There was a break above a key bearish trend line with resistance at $240 on the hourly chart of the SOL/USD pair. The price even smashed the $245 resistance. The bulls were able to push the price above the $250 barrier. A high was formed near $253 and the price recently corrected some gains.
There was a move below the 23.6% Fib retracement level of the upward wave from the $232 swing low to the $253 high. However, the bulls were active above $242.
Solana is now trading above $242 and the 100-hourly simple moving average. On the upside, the price is facing resistance near the $248 level. The next major resistance is near the $254 level. The main resistance could be $255. A successful close above the $255 resistance zone could set the pace for another steady increase. The next key resistance is $268. Any more gains might send the price toward the $272 level.
More Losses In SOL?
If SOL fails to rise above the $248 resistance, it could start another decline. Initial support on the downside is near the $242 zone and the 50% Fib retracement level of the upward wave from the $232 swing low to the $253 high. The first major support is near the $240 level.
A break below the $240 level might send the price toward the $232 support zone. If there is a close below the $232 support, the price could decline toward the $220 support in the near term.
Technical Indicators
Hourly MACD – The MACD for SOL/USD is losing pace in the bullish zone.
Hourly Hours RSI (Relative Strength Index) – The RSI for SOL/USD is below the 50 level.
Major Support Levels – $242 and $240.
Major Resistance Levels – $248 and $255.
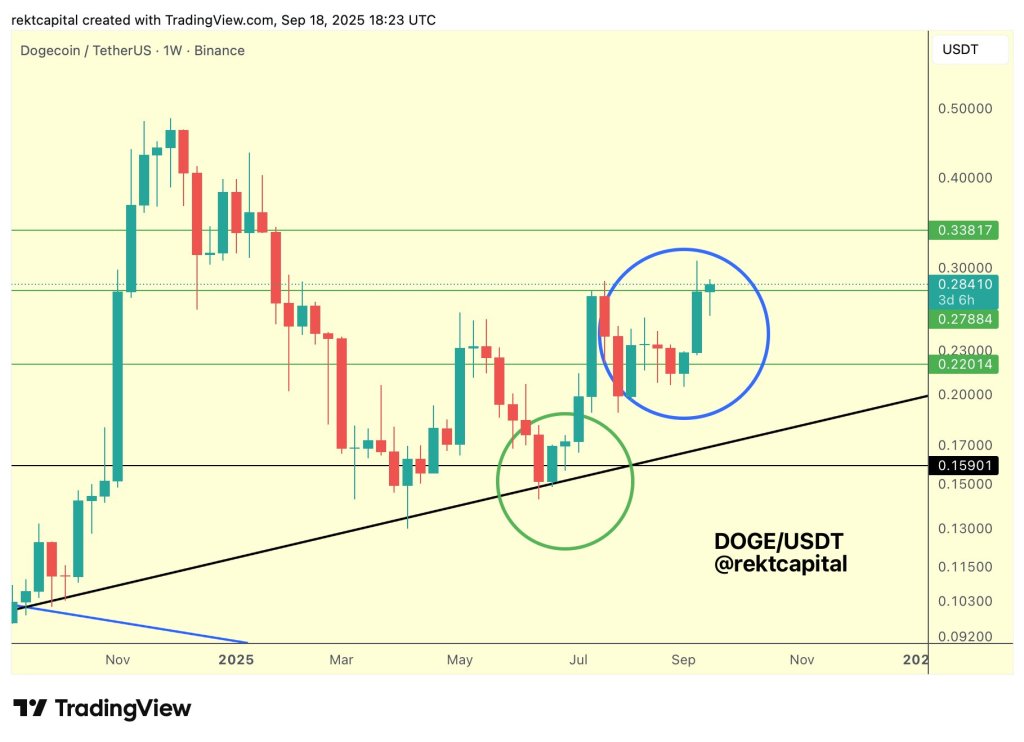
Dogecoin On Edge — 2.5 Days Remain To Lock In Breakout Springboard
Dogecoin is pressing a make-or-break weekly level as price retests the mid-$0.27s “springboard” high...
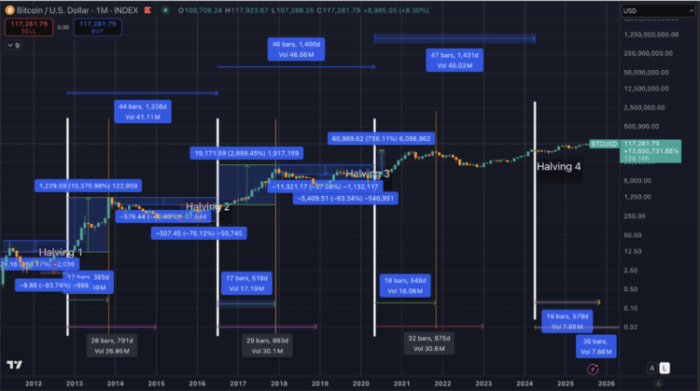
Bitcoin’s 25% Shot at $125K This Month Sends Traders Flocking to Bitcoin Hyper Presale
Polymarket bettors have predicted a 25% chance for Bitcoin ($BTC) to rise above $125K this month. It...
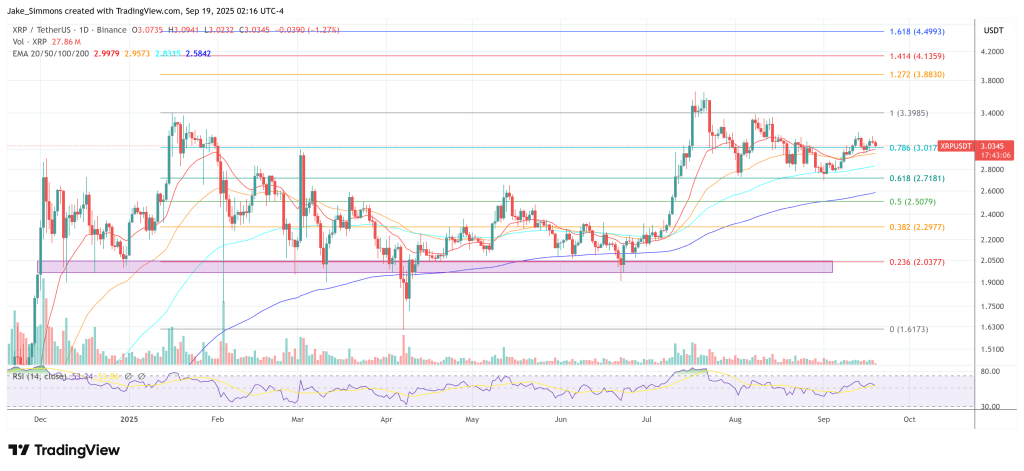
The $100 XRP Dream: Analyst Explains Why It’s A Fantasy
Crypto Insight UK used the first post-cut trading day to reframe the XRP narrative around what he ca...