Bitcoin Price Dips Again – Could This Spark Panic Selling Across Crypto Market?


Bitcoin price extended losses after it traded below $115,000. BTC is now moving lower and might even test the $110,500 support zone.
- Bitcoin started a fresh decline below the $115,000 zone.
- The price is trading below $114,500 and the 100 hourly Simple moving average.
- There is a bearish trend line forming with resistance at $114,000 on the hourly chart of the BTC/USD pair (data feed from Kraken).
- The pair might start another increase if it clears the $115,000 zone.
Bitcoin Price Dips Further
Bitcoin price failed to stay the $116,500 zone and started a fresh decline . BTC declined below the $115,500 and $115,000 support levels to enter a short-term bearish zone.
The decline gained pace below the $114,000 level. A low was formed at $112,050 and the price is now consolidating losses below the 23.6% Fib retracement level of the recent decline from the $117,920 swing high to the $112,050 low.
Bitcoin is now trading below $113,500 and the 100 hourly Simple moving average . Besides, there is a bearish trend line forming with resistance at $114,000 on the hourly chart of the BTC/USD pair.
Immediate resistance on the upside is near the $113,450 level. The first key resistance is near the $114,000 level and the trend line. The next resistance could be $115,000 or the 50% Fib retracement level of the recent decline from the $117,920 swing high to the $112,050 low.
A close above the $115,000 resistance might send the price further higher. In the stated case, the price could rise and test the $116,500 resistance level. Any more gains might send the price toward the $116,800 level. The next barrier for the bulls could be $117,250.
More Losses In BTC?
If Bitcoin fails to rise above the $114,000 resistance zone, it could start a fresh decline. Immediate support is near the $112,000 level. The first major support is near the $111,250 level.
The next support is now near the $110,500 zone. Any more losses might send the price toward the $108,800 support in the near term. The main support sits at $107,500, below which BTC might gain bearish momentum.
Technical indicators:
Hourly MACD – The MACD is now gaining pace in the bearish zone.
Hourly RSI (Relative Strength Index) – The RSI for BTC/USD is now below the 50 level.
Major Support Levels – $112,000, followed by $111,250.
Major Resistance Levels – $114,000 and $115,000.

Analyst Says Ethereum Bounce Is Imminent As BitMine Continues To Accumulate
After losing the $4,450-$4,500 area during the recent market downturn, Ethereum (ETH) is attempting ...
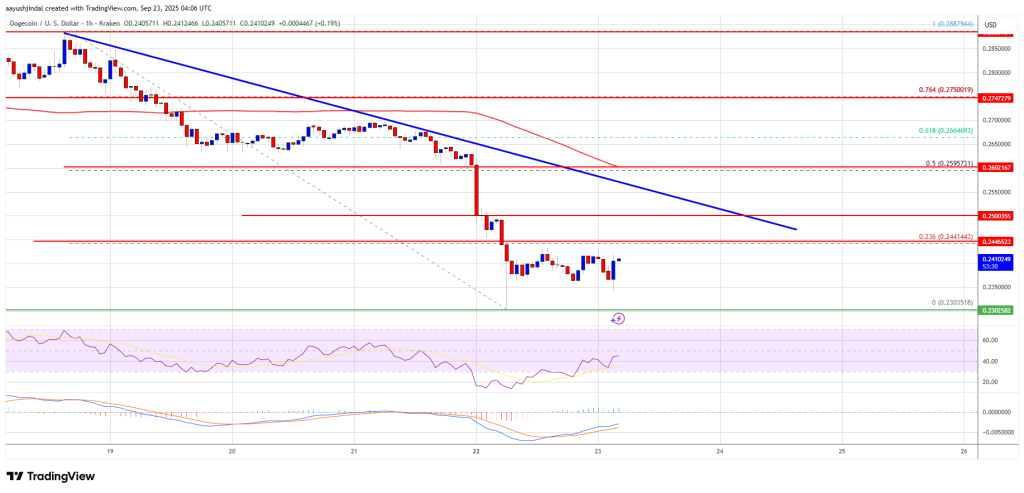
Dogecoin (DOGE) Extends Losses – Is This the Final Shakeout Before Big Rally?
Dogecoin started a fresh decline below the $0.2550 zone against the US Dollar. DOGE is now consolida...

Bitcoin Fear & Greed Index Signals ‘Fear’ As Price Falls To $112,000
Data shows the Bitcoin Fear & Greed Index has slipped back into the fear territory following the cra...