Solana (SOL) Shows Signs Of Rebound – Will Bears Step In Again Soon?


Solana started a fresh decline below the $225 zone. SOL price is now attempting to recover from $192 and faces hurdles near $215.
- SOL price started a fresh decline below $225 and $220 against the US Dollar.
- The price is now trading above $200 and the 100-hourly simple moving average.
- There was a break above a key bearish trend line with resistance at $200 on the hourly chart of the SOL/USD pair (data source from Kraken).
- The price could start another decline if it stays below $215 and $220.
Solana Price Dips Again
Solana price failed to stay above $220 and started a fresh decline, like Bitcoin and Ethereum . SOL traded below the $212 and $205 support levels to enter a bearish zone.
The bears even pushed the price below $200 and the 100-hourly simple moving average. A low was formed at $191 and the price recently started a recovery wave above the 23.6% Fib retracement level of the downward move from the $242 swing high to the $191 low.
Besides, there was a break above a key bearish trend line with resistance at $200 on the hourly chart of the SOL/USD pair. Solana is now trading above $200 and the 100-hourly simple moving average.
If there are more gains, the price could face resistance near the $212 level. The next major resistance is near the $215 level or the 50% Fib retracement level of the downward move from the $242 swing high to the $191 low. The main resistance could be $220.
A successful close above the $220 resistance zone could set the pace for another steady increase. The next key resistance is $230. Any more gains might send the price toward the $242 level.
Another Decline In SOL?
If SOL fails to rise above the $215 resistance, it could continue to move down. Initial support on the downside is near the $202 zone. The first major support is near the $200 level.
A break below the $200 level might send the price toward the $192 support zone. If there is a close below the $192 support, the price could decline toward the $180 support in the near term.
Technical Indicators
Hourly MACD – The MACD for SOL/USD is gaining pace in the bullish zone.
Hourly Hours RSI (Relative Strength Index) – The RSI for SOL/USD is above the 50 level.
Major Support Levels – $202 and $200.
Major Resistance Levels – $215 and $220.
Everyone’s Wrong About XRP: Here’s Why, Says Top Analyst
Top crypto commentator CryptoinsightUK argues that market consensus has misread the setup for XRP an...

Dogecoin Price Skirts Potential Demand Zone, What Happens If It Hits Right?
After rallying above $0.3 at the start of September, the Dogecoin price has faced significant resist...
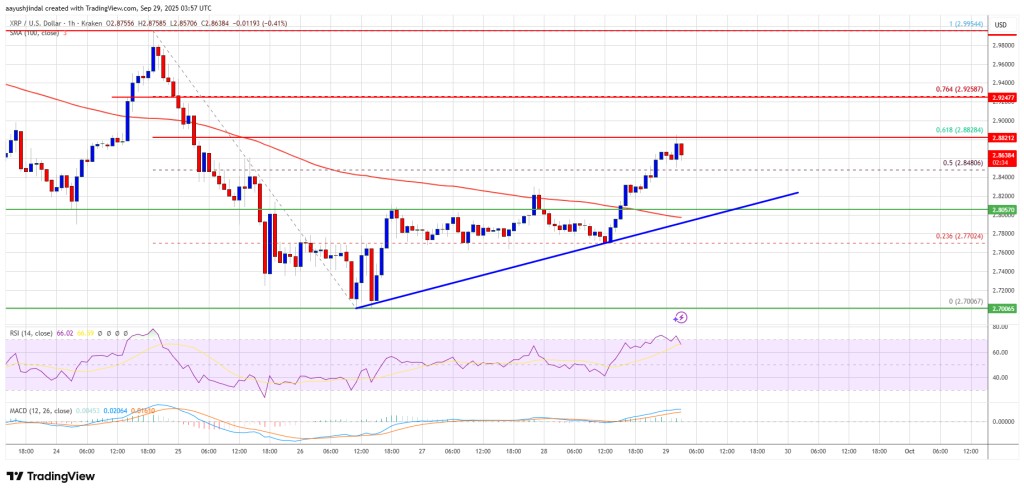
XRP Price Attempts Recovery – Can Market Push Higher Despite Strong Barriers?
XRP price is attempting a recovery wave above the $2.820 zone. The price now faces a couple of key h...