XRP Moves Higher – Approaching Resistance That Could Decide Next Trend


XRP price is attempting a recovery wave above the $2.850 zone. The price now faces a couple of key hurdles near $2.920 and $2.950.
- XRP price is slowly moving higher above the $2.850 support zone.
- The price is now trading above $2.850 and the 100-hourly Simple Moving Average.
- There is a connecting bullish trend line forming with support at $2.8320 on the hourly chart of the XRP/USD pair (data source from Kraken).
- The pair could continue to move up if it settles above $2.920.
XRP Price Faces Resistance
XRP price started a recovery wave after it found support above $2.720 and $2.770, like Bitcoin and Ethereum . The price was able to surpass the $2.80 and $2.850 resistance levels.
There was a clear move above the 61.8% Fib retracement level of the downward wave from the $2.995 swing high to the $2.70 low. The bulls even pushed the price toward $2.920 before they faced resistance. Besides, there is a connecting bullish trend line forming with support at $2.8320 on the hourly chart of the XRP/USD pair.
The price is now trading above $2.850 and the 100-hourly Simple Moving Average. On the upside, the price might face resistance near the $2.925 level or the 76.4% Fib retracement level of the downward wave from the $2.995 swing high to the $2.70 low.
The first major resistance is near the $2.950 level. A clear move above the $2.950 resistance might send the price toward the $3.00 resistance. Any more gains might send the price toward the $3.050 resistance. The next major hurdle for the bulls might be near $3.120.
Another Decline?
If XRP fails to clear the $2.920 resistance zone, it could start a fresh decline. Initial support on the downside is near the $2.850 level. The next major support is near the $2.8320 level and the trend line.
If there is a downside break and a close below the $2.8320 level, the price might continue to decline toward $2.770. The next major support sits near the $2.720 zone, below which the price could continue lower toward $2.650.
Technical Indicators
Hourly MACD – The MACD for XRP/USD is now gaining pace in the bullish zone.
Hourly RSI (Relative Strength Index) – The RSI for XRP/USD is now above the 50 level.
Major Support Levels – $2.8320 and $2.770.
Major Resistance Levels – $2.920 and $2.950.
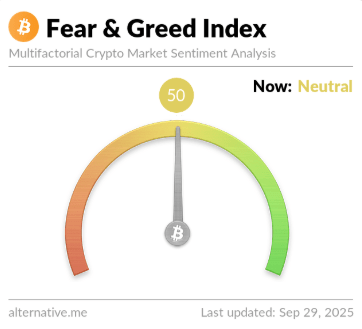
Bitcoin Sentiment Returns Back To Neutral As BTC Breaks $114,000
Data shows the Bitcoin Fear & Greed Index has retreated into the neutral territory as the BTC price ...
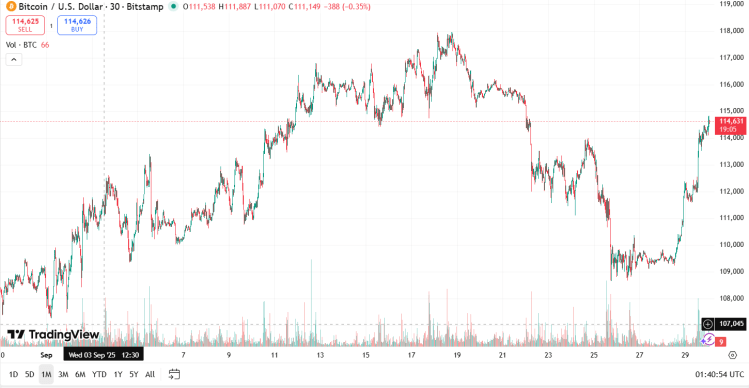
Bitcoin Reclaims $114K as Crypto Market Recovers — Maxi Doge Presale Heats Up
As September ends, Bitcoin reclaims $114K – a meaningful intraday bounce that also pushes the total ...
BlackRock Dethrones Coinbase in Bitcoin Options – Why Bitcoin Hyper Presale Could Be the Next Big Winner
BlackRock’s iShares Bitcoin Trust (IBIT) has surpassed Coinbase’s Deribit platform, becoming the lar...