
According to TradingView, the latest onchain data shows that a large percentage of Bitcoin investors who are considered long-term holders have consistently sold their coins.
Onchain analyst Burak Kesmeci analyzed the current structural bias among Bitcoin's long-term holders on November 1 on the social media platform X.
With a 30-day time horizon, Kesmeci tracked the net buying and selling activities of Bitcoin's long-term investors using the Long-Term Holder Net Position Change statistic.
If the signal is good, it usually means that long-term holders are buying more Bitcoin than selling, indicating that they are in a net accumulation phase. In contrast, long-term holders are likely approaching a distribution phase if the Long-Term Holder Net Position Change metric is negative.
There has been an increasing tendency favoring the sell side of the metric, as pointed out by Kesmeci in his analysis.
Over the last 30 days, almost 400,000 BTC have been liquidated, according to the chart. Something that should be noted is that long-term holders are still selling, which is a worrying trend.
Bitcoin'de uzun vadeli yatırımcıların net pozisyonu "satış" yönünde ivmeli bir şekilde devam ediyor.
— Burak Kesmeci (@burak_kesmeci) November 1, 2025
İşte bu ivmenin azalıp, nötr bölgeye yaklaştığı yerde lokal dibin oluşması muhtemel. pic.twitter.com/xLUhBUF3tM
That potentially suggests a return of interest and strategic positioning by informed investors for the upcoming cycle; a local price bottom could be signaled if long-term Bitcoin holders opt not to sell their assets.
The leading crypto may see additional downward trending if this distribution momentum continues and its long-term holders increase their bearish pressure.
Technical View
TradingView's Bitcoin analysis summary based on the most popular technical indicators, such as moving averages, oscillators, and pivots, showed a neutral sign for the week ahead, compared to a buy last week.
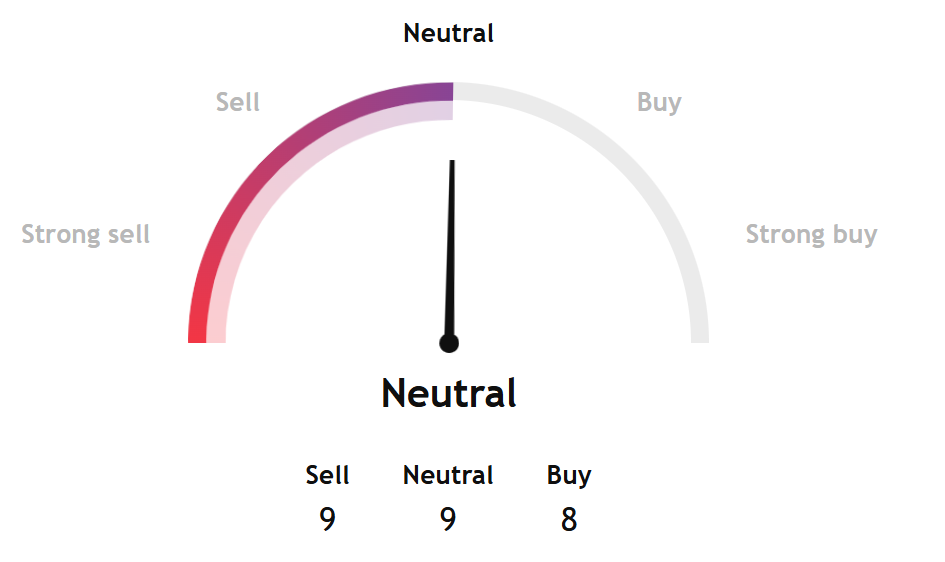
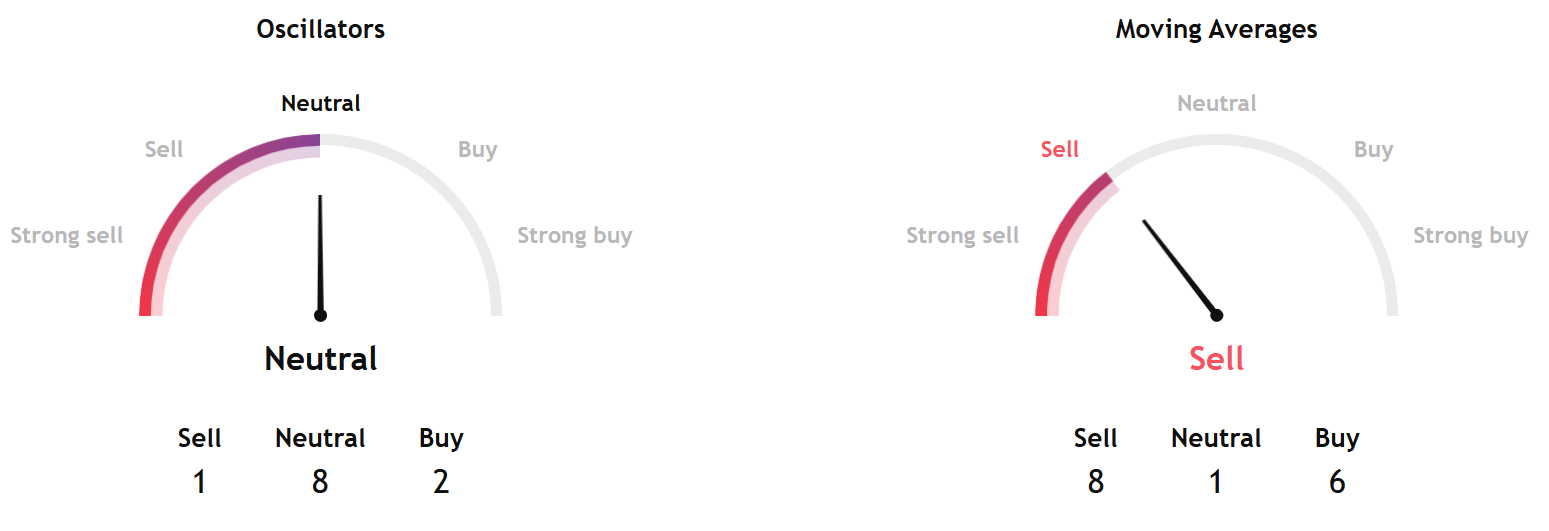
The long-term measures have also turned negative, with the moving averages indicators showing a sell signal. The short-term oscillators point to a neutral stance.
Separately, InvestTech's Algorithmic Overall Analysis shows a weak negative signal for their one to six weeks recommendation.
According to their analysis, for the time being, Bitcoin's price is moving within what appears to be a horizontal trend channel. This shows that investors are still unsure of where the market is heading and are waiting for more signs. A break to the upside will be seen as a positive indication, and a break to the downside as a negative one.
There is support at $107,200 and resistance at $109,600 for the OG token.
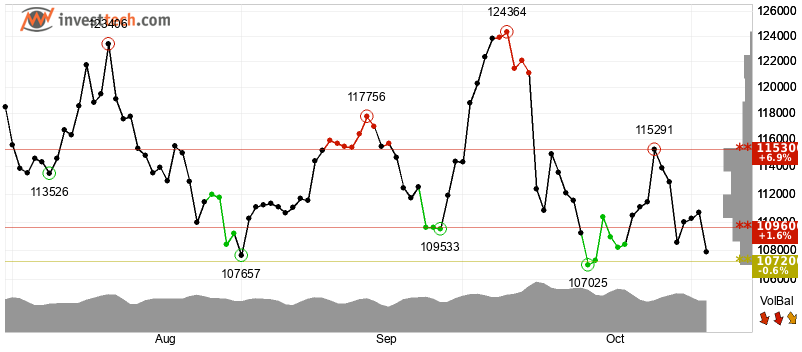
When Bitcoin finally clears one of these levels, we'll know the right direction. The token loses value when the volume is high, when prices are decreasing, and low when prices are rising, as shown by a negative volume balance.
According to SoSoValue data, the Daily Total Net Open Interest (Delta) was -$1.68 billion.
That indicates a negative difference in the daily changes of open contracts between calls and puts.
The increase in open contracts for puts suggests that market makers need to sell underlying assets to hedge their positions, resulting in the sale of more ETFs.
In the near term, Bitcoin is seen as slightly negative from an overall technical standpoint.