


Ethereum is facing renewed selling pressure as the broader market struggles with fear, uncertainty, and growing bearish expectations. After weeks of weakness, many analysts are now openly calling for a prolonged bear market stretching into 2026, arguing that Ethereum remains below key structural levels and lacks strong momentum.
Bulls are attempting to defend the $2,800 mark, a level that has become critical for maintaining short-term confidence, but price action continues to reflect hesitation rather than conviction. Volatility remains elevated, and market sentiment is dominated by caution rather than optimism.
Against this fragile backdrop, on-chain data reveals a notable divergence between price action and behavior from experienced market participants. According to data from Hyperdash, the Bitcoin OG, known for shorting the market during the October 10 crash, has once again increased his exposure to Ethereum.
This trader, widely followed for his high-conviction and well-timed positioning, just added another 12,406 ETH to his long positions, signaling confidence at current price levels despite the prevailing bearish narrative.
While retail sentiment weakens and analysts debate deeper downside scenarios, strategic accumulation by seasoned players suggests that Ethereum may be approaching a decisive phase. Whether this marks early positioning ahead of a recovery or a high-risk bet in a deteriorating market remains the key question ahead.
A High-Conviction Bet Under Pressure
Lookonchain reports that the Bitcoin OG continues to hold substantial, high-conviction positions across multiple assets, despite the ongoing market weakness. According to the latest data , his current exposure includes 203,341 ETH valued at approximately $577.5 million, 1,000 BTC worth around $87 million, and 250,000 SOL valued near $30.7 million. This level of concentration highlights a willingness to endure significant volatility rather than reduce risk in an increasingly uncertain environment.
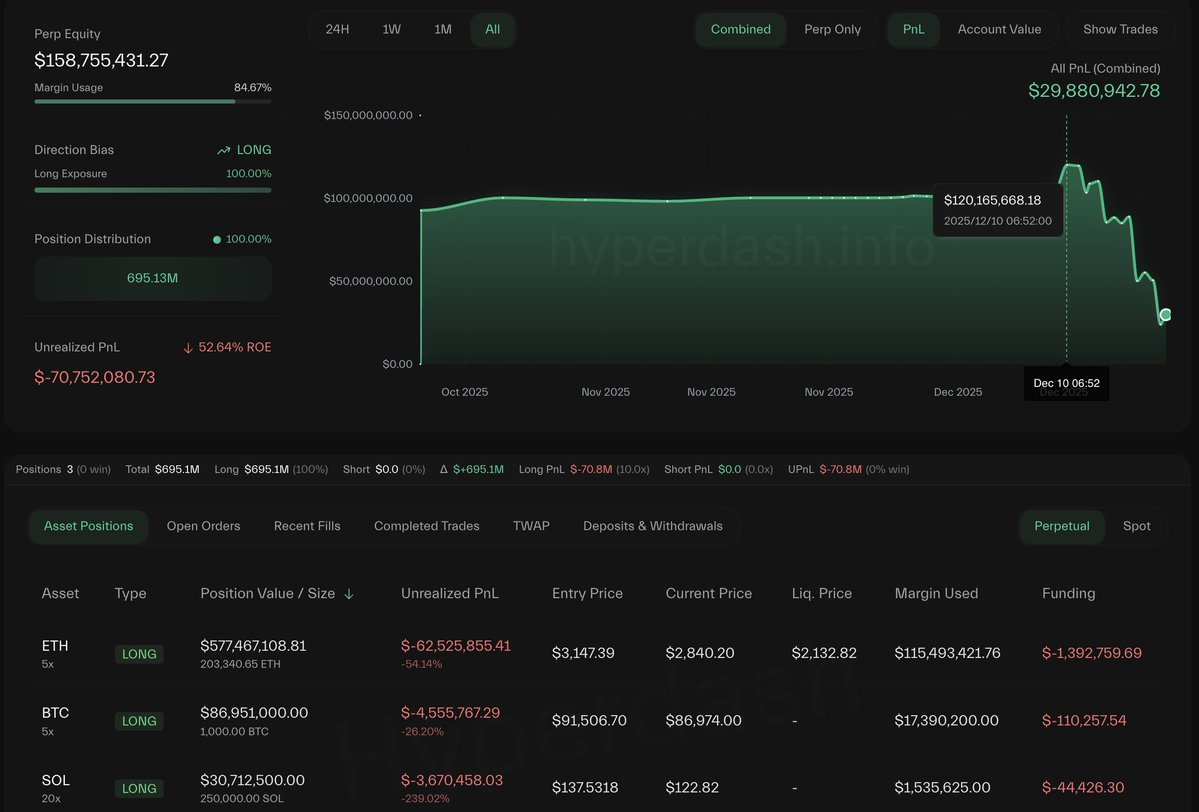
That conviction, however, has come with meaningful drawdowns. The wallet is now down more than $70 million from its peak. At one point, unrealized profits exceeded $120 million, but recent price declines have reduced that figure to less than $30 million. The swing illustrates how quickly market conditions can shift, even for traders with a strong track record and well-timed entries in the past.
From a broader market perspective, this positioning reflects a sharp contrast between sentiment and behavior. While many participants have turned defensive and analysts debate the likelihood of a prolonged bear market, this wallet remains heavily exposed, suggesting a belief that current levels may still offer asymmetric upside. At the same time, the drawdown serves as a clear reminder that size and conviction do not remove risk in a structurally fragile market.
Ethereum Tests Structural Support Amid Growing Pressure
Ethereum’s weekly chart highlights a clear loss of momentum after the rejection near the $4,800–$5,000 region, followed by a sharp retracement toward the $2,800–$2,900 zone. Price is currently trading below the 50-week moving average and hovering near the 100-week MA, a level that historically acts as an important inflection point for medium-term trend direction. The failure to hold above the short-term averages confirms that sellers have regained control of the structure.
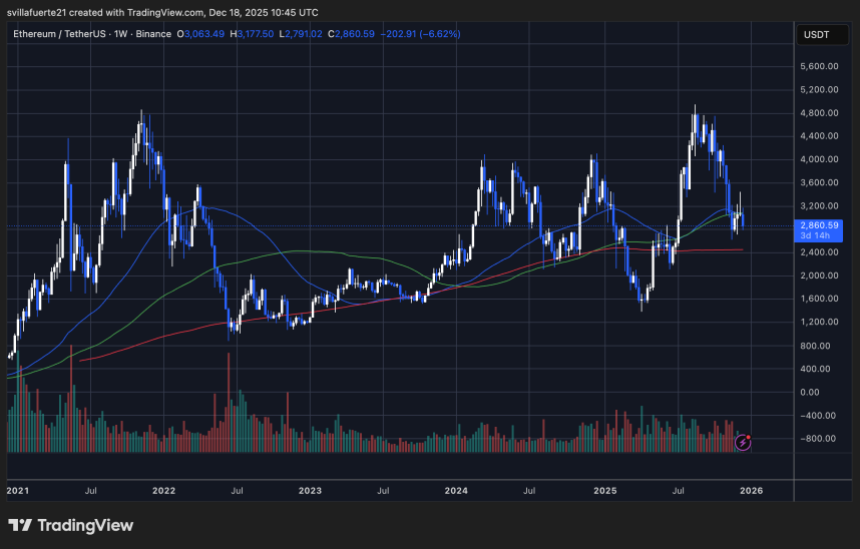
From a trend perspective, ETH remains above the rising 200-week moving average, which continues to define the long-term bullish framework. However, the widening gap between the faster and slower averages has started to compress, signaling a transition phase rather than trend continuation. Volume has expanded on down weeks, reinforcing the idea that recent downside moves are driven by active distribution rather than passive consolidation.
The $2,800 area now represents a critical demand zone. A sustained hold above this level would suggest that the correction is a controlled pullback within a broader range. Conversely, a weekly close below it would expose ETH to a deeper retracement toward the $2,400–$2,500 region, where the 200-week MA and prior consolidation converge.
Overall, the chart reflects a market caught between long-term structural support and short-term bearish momentum. Ethereum needs a decisive reclaim of the 50-week moving average to neutralize downside risk and restore confidence in trend continuation.
Featured image from ChatGPT, chart from TradingView.com

