
Efforts to recover and persistent macroeconomic worries are causing the price of Bitcoin to oscillate.
The top token's price is in a sensitive stage within its broader market framework.
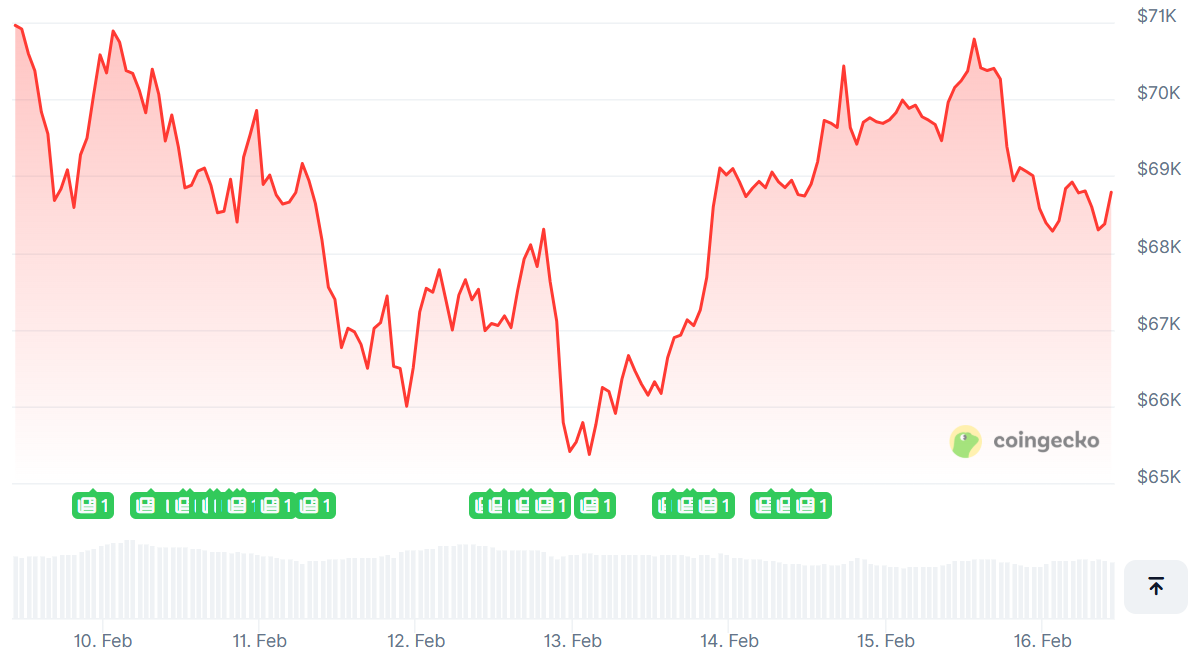
Currently, the market is in a stage of transition, having moved away from a period of exuberant expansion but not yet entering a condition of complete surrender. The price of Bitcoin was unable to maintain its position above $70,000 and has begun to experience another downturn.
BTC is currently positioned under the $69,200 support zone and could potentially experience further declines in the short term.
The current dynamics of the market show how those driven by short-term, speculative objectives are competing with others who have longer-term, conviction-based views.
The top cryptocurrency, nevertheless, may be about to see further losses, according to onchain data.
According to market researcher Ali Martinez's latest chart on social platform X, the Cumulative Value - Days Destroyed (CVDD) has identified Bitcoin's lowest point since 2012.
CVDD (Cumulative Value-Days Destroyed) has identified Bitcoin $BTC bottoms since 2012.
— Ali Charts (@alicharts) February 14, 2026
Current level: $45,225. pic.twitter.com/Kx3PTviPRq
This measure, which is now valued at $45,225 according to the expert, is highly regarded for its ability to identify structural lows over the long term on the blockchain.
Satoshi Nakamoto introduced CVDD in 2009 as a way to value Bitcoin over the long run.
Its goal is to identify major market bottoms by analysing how holders behave over the long term.
The idea of Coin Days Destroyed (CDD) must be understood in order to understand the CVDD measure of Bitcoin. The total amount of Bitcoin that has been collected but is still in a wallet is called CDD.
To determine a price that has historically matched the important Bitcoin cycle bottom, CVDD now tracks the entire historical value of destroyed coin days and uses this information in its valuation model.
As far back as 2012, CVDD has consistently and remarkably pinpointed major Bitcoin price bottoms.
At its core, the model evaluates when older, long-held coins are spent. When the market is doing well, long-term investors will sell. When the market is doing poorly, they will purchase.
In light of market volatility, CVDD has consistently provided a safety net during price declines. During the lows of various market cycles, including those in 2015, 2018, and 2022, Bitcoin's price occasionally fell beneath the CVDD line before initiating significant long-term recovery.
Experts think existing market conditions present a significant opportunity at $45,225 for CVDD.
Understanding this level as a historically important structural support is essential if market conditions deteriorate, though it does not guarantee that the price will fall to this level.
The overall market tends to be in a stronger macro position when BTC consistently trades above CVDD. Conversely, when Bitcoin's price approaches a decline, individuals often experience negative sentiments and are inclined to gather more coins for future gains.
While Bitcoin continues to find its footing in its present range, it could be instructive to watch if the price remains enough above the $45,225 CVDD mark.
Although a change in tactics in this direction might mean more correctional pressure, the fact that the cycle has been consistently strong above this level suggests it is still fundamentally solid.
Bitcoin Dips Below Key Level
Once it surpassed the $70,000 mark, the price of Bitcoin couldn't stay there. After breaking below the $69,200 support level, Bitcoin has begun a fresh decline.
Something changed below the $69,000 level.
According to TradingView, the price has dropped below the $70,935 high, which is the 38.2% Fibonacci retracement mark of the rise from the $65,072 swing low.
Support for the hourly BTC/USD pair is at $69,500, and a negative trend line underneath it. The current price of Bitcoin, at around $68,600, is quite close to the 100-hour simple moving average.
If the price remains stable over $68,000, a fresh upward trend would be possible. Approximately $68,800 is the current level to keep an eye on.
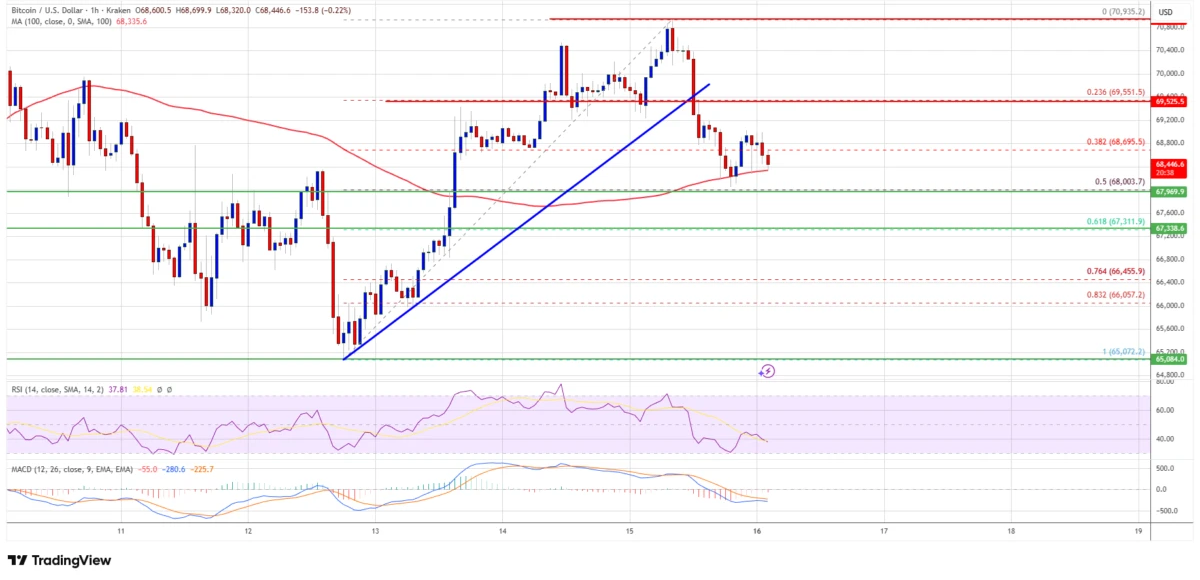
Roughly speaking, the $69,500 milestone is the first major obstacle.
Price escalation is possible if the $69,500 resistance level is broken. The price might rise and test the $70,000 level of resistance in this case. The price might reach $70,500 if there are more hikes. Potentially approaching levels of resistance for the bulls are $72,000 and $72,500.
However, Bitcoin can start a new decline if it can't break over the $69,500 barrier mark.
Nearby support is available for about $68,200. Starting from the $65,000 swing low and working its way up to the $70,935 peak, the 50% Fibonacci retracement level and the first major support level are both located around $68,000.
Currently, the $67,350 mark is where the next level of support is located.
If the price continues to fall, it may hit the $67,350 support level. Bitcoin may see difficulties in its near-term recovery if it drops below the current key support level of $66,500.