
As Asian market players processed a major geopolitical disruption from the Middle East, Bitcoin and other cryptocurrencies experienced a slight but persistent decline on Monday morning.
Oil prices soared as Asian markets fell in reaction to the weekend escalation of tensions between the US-Israel team and Iran.
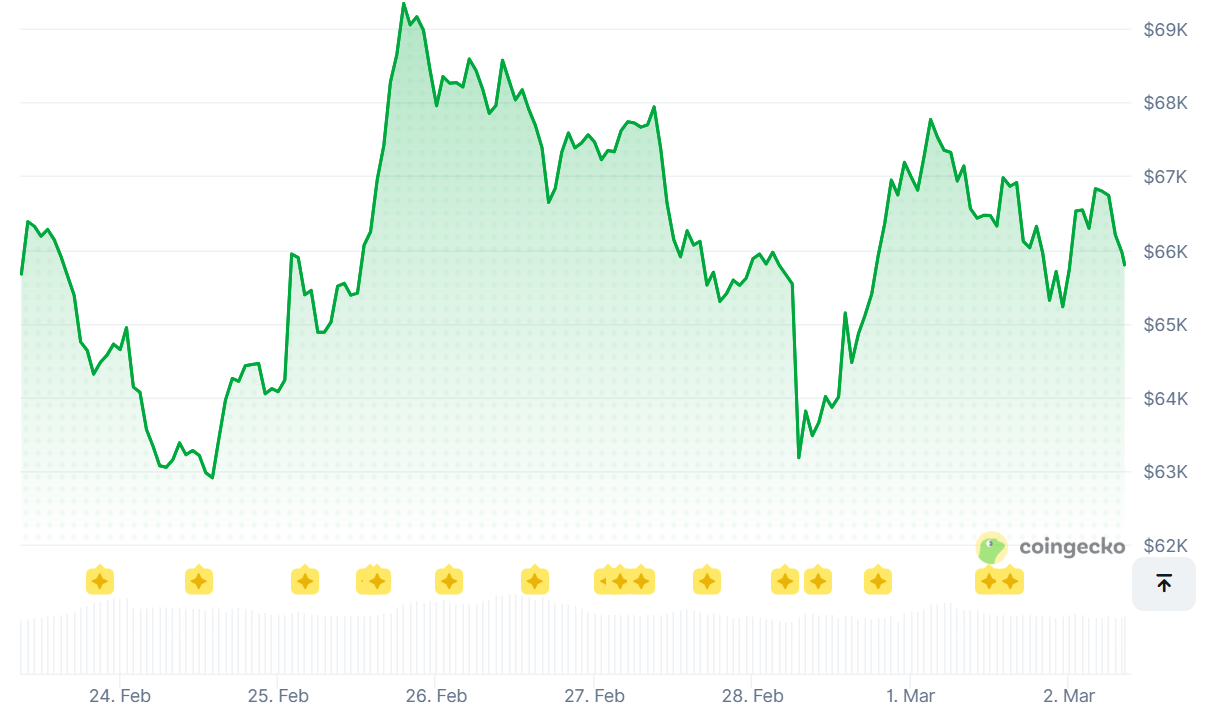
The top token fell nearly 2% to about $65,850 over the past 24 hours.
Recent developments were influenced by fluctuations over the weekend linked to rising tensions, particularly following the announcement of the death of Iran's supreme leader, Ayatollah Ali Khamenei, due to a US-Israeli airstrike.
Over the weekend, Bitcoin's price fluctuated between $63,000 and $66,000. But crypto volatility was small compared to traditional markets and other periods of cautious optimism.
The US-Israeli assault on Iran caused a selloff in cryptocurrency over the weekend, sending Bitcoin and Ethereum down into intermediate support as risk assets were unwound.
While traditional markets were still and unable to respond, digital asset prices quickly rebounded as traders processed new information, demonstrating the ongoing liquidity and resilience of the digital asset market.
Reports show at least five civilians were killed in Iranian strikes on important areas in the region, prompting Gulf states to hint that they may retaliate.
On Sunday, US President Trump made it clear in his post on Truth Social that he would not hesitate to respond forcefully to the withdrawal of American forces from the area.
The trading of the crypto markets through the weekend attracted significant interest from risk-averse investors.
Even with a significant decline in Asian stocks at the start of the week, Bitcoin held steady near the $66,000 mark. The market appears to be viewing the geopolitical shock primarily as a short-term concern rather than the beginning of a prolonged decline.
The conventional markets exhibited a more pronounced response upon their reopening on Monday.
Brent crude prices reached almost $78 per barrel, indicating a 7% rise in only one day, as oil prices rose. During this time, the price of gold rose to $5,381/oz, a gain of 1.9%.
Cryptocurrencies and other high-risk assets are vulnerable to geopolitical upheavals, according to experts, and oil remains the principal conduit via which this happens.
Inflation expectations are set to rise, real rates are expected to level off, and the USD is expected to gain if crude oil pushes through over $90.
Because of this, liquidity is limited, and the behavior of cryptocurrencies is likely to resemble that of a high-beta macro asset.
Since the Strait of Hormuz is a critical passage for around 20% of the world's oil supply, the markets react strongly to any possible interruptions in shipping through the waterway.
At least three instances involving attacks on ships occurred close to the Strait of Hormuz, according to BBC reporting.
Already, shipping insurance premiums have risen, and vessel routes have changed due to disruption fears, which have increased inflation concerns and might impact central bank choices on interest rate cuts.
Steady or Silence Before the Storm?
In light of the recent geopolitical developments, onchain and derivatives indicators have demonstrated a surprising level of stability within the cryptocurrency market, indicating minimal systemic stress.
In the midst of the weekend's turmoil, Hyperliquid, a platform for perpetual futures, experienced significant engagement in contracts related to oil and metals, facilitating ongoing price discovery.
This around-the-clock derivatives market may have significantly contributed to managing the macro shock as it unfolded.
Experts say the crypto market is responding to broader market risk sentiment, yet it has shown a notable stability in comparison to conventional assets.
The direction will depend significantly on the same factors impacting worldwide stocks: oil prices, inflation outlooks, and developments in the Iran situation.
There will likely be more volatility before a clear trend emerges, but overall, cryptocurrency performance should mirror broader macroeconomic trends. Investors are keeping a careful eye on the market to see if this is merely a news-driven increase or if it will turn into a more permanent shift in financial conditions.
Whether oil prices stabilise or move into a persistently higher range should be the primary focus of attention when considering asset values. They are keeping an eye on the dollar and U.S. real rates to see if the shock is causing a broader change in the macroeconomy.
Fed & Bitcoin Bets Amid Iran Conflict
Cryptocurrency markets might see a boost if the US Federal Reserve considers easing its stringent monetary policy to back the country's efforts in its fight against Iran.
The Federal Reserve has responded to every US president's decision to launch military operations in the Middle East since 1985 by reducing interest rates and raising the money supply.
But with a surge in oil and its impact on inflation, there seems to be a divide among analysts on the next Fed moves.
Next Moves?
The price of bitcoin began a steady ascent above $66,000 before the weekend hit. Bitcoin is currently forming a base above $65,500 and may try to push its price higher, perhaps over $67,200.
Above the $63,500 mark, the price of Bitcoin has solidified its position. Bitcoin has broken past the $64,500 barrier mark, igniting a fresh upward trend.
The price has broken out of the $67,000 range. At some point close to the $68,000 threshold, the vendors finally made their move.
The price has since retraced some of its gains after reaching a top of $68,180. A fall took place below the $63,030 swing low, which is the 50% Fibonacci retracement level of the upward trend to the $68,181 top.
Currently, Bitcoin is trading under the 100-hour simple moving average, hovering around $67,000.
If the price maintains its position above $65,000, it could potentially initiate a new upward trend.
Currently, there is a notable barrier at approximately $67,000. On the hourly chart of the BTC/USD pair, a downward trend line is forming, suggesting that $67,000 serves as a barrier.
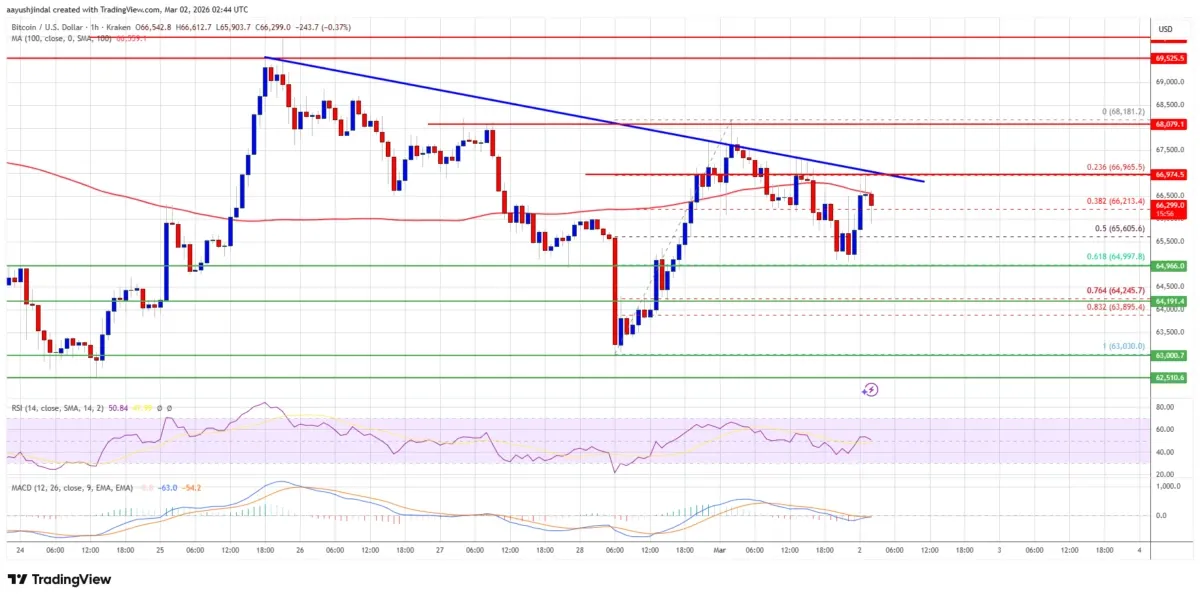
The initial significant hurdle appears to be at the $68,200 mark.
The value could potentially increase significantly if it surpasses the $68,200 threshold. Given the current circumstances, there is a possibility for the price to increase and approach the $69,500 resistance level.
If the upward trend continues, we could potentially reach a valuation of $70,000. In the next moves, we could see some optimistic resistance levels around $71,200 and $70,500.
Bitcoin may start another decline if it can't break through the $67,000 level.
Around the $65,500 mark, you can find immediate support.
Near the $65,000 level, which corresponds to the 61.8% Fibonacci retracement level of the ascent from the $63,030 swing low to the $68,181 top, is where the first substantial support may be located.
Currently, the $64,250 region is considered the impending support level. The $64,000 support level may be reached in the near future if the price continues to fall.
Bitcoin would encounter difficulties in achieving a short-term recovery if it drops below $63,000, the principal level of support at present.
What Do Other Technicals Show?
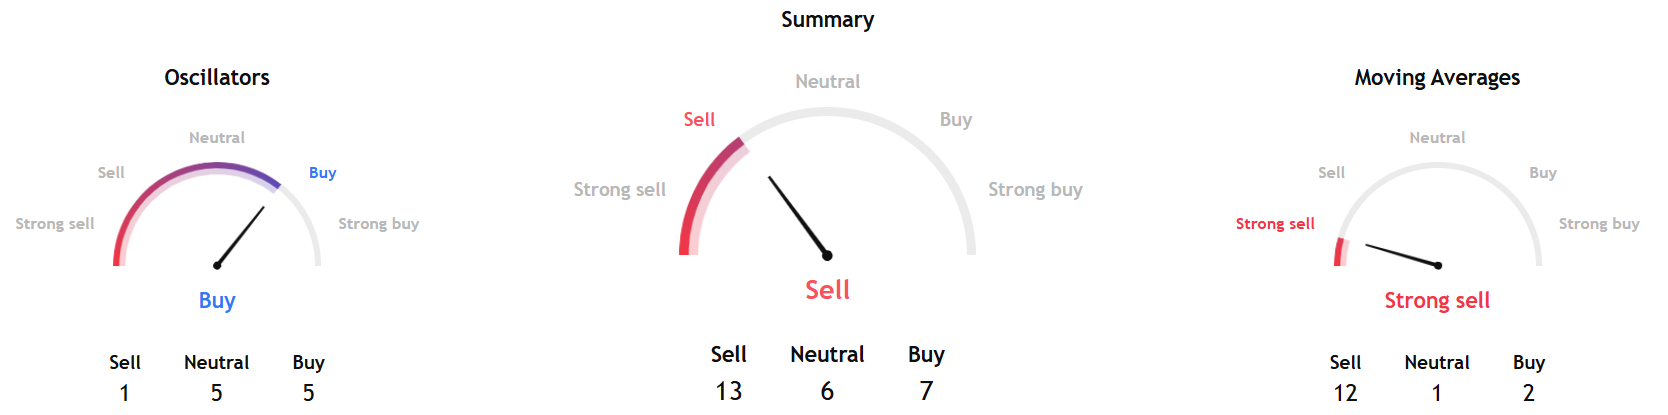
TradingView's overall Bitcoin summary gauge, based on key data from moving averages, oscillators, and pivots for the week ahead, shows a sell reading.
However, for the first time in several weeks, short-term gauges point to a buy signal.
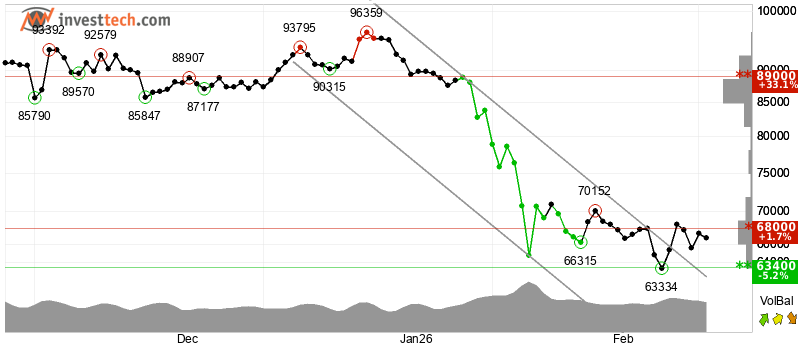
Separately, InvestTech's Algorithmic Overall Analysis and the one to six weeks recommendation showed a negative score.
InvestTech noted, "Bitcoin has broken through the ceiling of a falling trend channel in the short term. This indicates a slower falling rate initially, or the start of a more horizontal development. The token is approaching resistance at $68,000, which may give a negative reaction. However, a break upwards through $68,000 will be a positive signal."
The research added, "RSI diverges positively against the price, which indicates a possibility for a reaction up. The token is overall assessed as technically negative for the short term."
SoSoValue's Daily Total Net OI (Delta) showed a negative $473.76 million.
The Daily Total Net Open Interest indicates the difference in the daily changes of open contracts between Calls and Puts.
So, the negative reading indicates an increase in open contracts for Puts and suggests that market makers need to sell underlying assets to hedge their positions, resulting in the sale of more ETFs.
Even the ETF data from SoSoValue pointed to net outflows last week, which needs to reverse for Bitcoin to break out above the current range.
Be at the heart of TradFi–DeFi collaboration at Money20/20 Asia 2026 .
Are you looking to forge partnerships with banks and fintechs? To expand into new markets across Asia, or to secure funding from top-tier investors? This April, the world of digital assets, blockchain, and Web3 converges with the biggest players in APAC’s financial ecosystem at Money20/20 Asia 2026 and its brand new ‘Intersection’ zone, complete with a dedicated content stage, TradFi-Defi innovator showcase, and curated networking spaces. From traditional banking giants to decentralised innovators, private equity leaders, and cutting-edge fintech disruptors, this is where they meet to forge partnerships, spark dialogue, and shape the future of finance.