Bitcoin fell to $66,983 on Wednesday, down more than 4% in 24 hours, as sustained institutional selling and deteriorating macroeconomic conditions pushed the asset to its lowest level in nearly two months. From its October all-time high of $126,000, Bitcoin has now retreated 47%.
The immediate macro catalyst is the Middle East. Iran has suspended indirect ceasefire talks with the United States and is now threatening to completely block the Strait of Hormuz, one of the world's critical oil transit chokepoints. Tehran has attributed the breakdown to continued US military strikes and Israeli operations in Lebanon. For Bitcoin, which has behaved increasingly like a high-risk speculative asset rather than a macro hedge, the effect has been direct and negative.
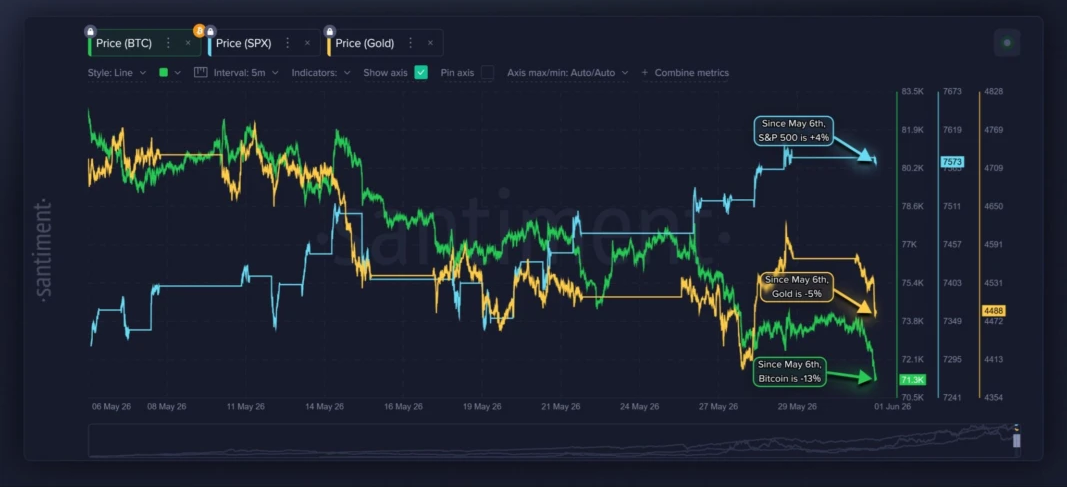
That decoupling from safe-haven behaviour is the more telling story. On Monday, the S&P 500 rose above 7,600 points and the Nasdaq surpassed 27,000, while Bitcoin continued falling. The divergence is no longer easily explained away as noise.
Binance Research offered a structural explanation this week: crypto's recent weakness may be driven less by crypto-native factors and more by capital being pulled into US equities. The Cboe Dispersion Index has risen to 42, the third-highest level on record, indicating that S&P 500 flows are heavily concentrated in a small number of themes — AI, semiconductors, defence, energy and commodities — leaving Bitcoin increasingly sidelined as institutional allocators chase returns elsewhere.
1/5
— Binance Research (@BinanceResearch) June 2, 2026
Why is crypto weak lately? The answer may not lie in crypto itself — but in equities.
CBOE Dispersion Index hit 42 — 3rd highest ever. It means extreme capital concentration within the S&P 500. When a few hot themes absorb all the flows, BTC gets sidelined. ?? pic.twitter.com/TvSx6PiHvs
The ETF flow data makes that rotation visible. US spot Bitcoin ETFs have now recorded twelve consecutive days of net outflows. Tuesday's withdrawals totalled $519.1 million, building on Monday's $483.6 million. The cumulative drain since mid-May is approaching $4 billion. According to CoinShares, crypto investment vehicles overall saw $1.7 billion in outflows last week alone — the second-largest weekly loss of 2026 — with total assets under management falling to $141 billion from $148 billion in April.
The most striking evidence of institutional urgency came through a single trade. NYDIG's head of research Greg Cipolaro identified a $1.26 billion block sale of BlackRock's IBIT executed via a dark pool: 29.2 million shares sold at roughly $43.16, a $1.01 discount to the prevailing market price, with the seller paying approximately $29.5 million in premiums for immediate execution.
"At least one sophisticated holder was willing to pay approximately $29.5 million to eliminate a $1.26 billion bitcoin-linked position immediately," Cipolaro wrote. That willingness to absorb $29.5 million for the sake of speed implies urgency rather than routine portfolio rebalancing.
Against that backdrop, Michael Saylor's Strategy disclosed its first Bitcoin sale since 2022, liquidating 32 BTC valued at around $2.5 million between May 26 and May 31 to facilitate preferred stock distributions. Negligible in scale relative to the company's total holdings, but the symbolism cut through: the company that made perpetual Bitcoin accumulation its defining identity had become, even briefly, a net seller.
The derivatives market reflects the same caution. After a major deleveraging event in October — when exchanges cleared around 71,000 BTC worth approximately $11 billion from open interest — the futures market has not recovered. Total open interest remains more than 24,000 BTC below pre-incident levels, with traders reluctant to rebuild leveraged positions. The Crypto Fear and Greed Index registered 29 out of 100 on Monday.
Onchain analyst PlanB framed the cycle position starkly in a June 1 post: "Bitcoin closed May at $73,568. Market is 50/50 on if February's $60,000 was the bottom, or the bear will continue. IMO data is telling us that we have not seen bottom formation yet, and that there is a >50% probability that we go lower."
Bitcoin closed May at $73,568
— PlanB (@100trillionUSD) June 1, 2026
Market is 50/50 on if Febryary $60k was the bottom, or the bear will continue.
IMO data is telling us that we have not seen bottom formation yet, and that there is a >50% probablility that we go lower (below 200wma $61k or realized price $53k). pic.twitter.com/4uxdxH5oGA
His analysis centres on the percentage of Bitcoin supply currently in profit. In previous cycle bottoms, that figure collapsed as holders capitulated. Right now, more of the supply is still in profit than at comparable points in past bear phases, which PlanB reads as meaning the full capitulation phase has not arrived.
The technical picture gives little comfort either. On the 4-hour chart, Bitcoin is in a clear downtrend with MACD lines negative and the RSI in oversold territory. Trader Ted Pillow identified $70,000 as the line that mattered: a sustained daily close below it, he argued, would trigger fresh selling from short-term holders. That close has happened. Using Transactional Liquidity (TLQ) analysis, the nearest 4-hour support is at $67,662. A break there opens a path toward $65,000, a level Bitcoin has not tested since March.
Longer-term, analysts are watching two levels. The 200-week moving average sits at approximately $61,000, a floor that has held during every extended correction in Bitcoin's history. Below that, the aggregate cost basis of the entire Bitcoin supply sits at around $53,000. PlanB's models point to either of those as the more probable location for a genuine bottom than the current range.
The Binance Research framing, however, offers a different reading of the same data. In past periods of extreme US equity concentration comparable to current conditions, Bitcoin has typically bottomed within zero to twenty weeks, with a median of around two weeks. Absent a crypto-native catalyst — an exchange collapse, a major protocol failure, a regulatory shock — capital diversion of this kind has historically been temporary. The current downturn appears to be the former rather than the latter: a macro rotation into concentrated equity themes, not a structural breakdown within crypto itself.
That distinction matters for how long this lasts. If Binance Research's historical pattern holds, the question is not whether Bitcoin recovers, but whether the $61,000 or $53,000 levels are tested first.