A crypto liquidation is the forced, automatic closure of your leveraged position when your margin balance drops to or below the exchange’s maintenance margin requirement. If you are reading this because your position is close to that threshold right now, here is what to do immediately:
- Check your mark price , not the last trade price. The mark price is what triggers liquidation.
- View your displayed liquidation price on the exchange interface. If the current mark price is within 5–10% of that number, act now.
- Add collateral to an isolated position to push the liquidation price further away. On cross-margin, adding funds to your account balance has the same effect.
- Set or tighten a stop-loss above your liquidation price so you exit on your terms, not the exchange’s.
- Reduce position size if you cannot add collateral. Cutting size lowers your notional exposure and raises your effective margin ratio.
One critical distinction: spot holdings cannot be liquidated, but if you want to stay connected while trading, consider an eSIM that accepts crypto payments for seamless global data access. Forced closure applies only to margin accounts and derivatives like perpetual futures and options. The mechanics below are drawn from exchange margin documentation and mark-price standards used across major platforms.
Key Takeaways
Crypto liquidations are forced position closures triggered by margin falling below maintenance requirements, and the most reliable defense is position sizing by account-risk percentage combined with stop-losses set well above the liquidation price.
| Point | Details |
|---|---|
| Liquidation trigger | Mark price hitting your maintenance margin threshold closes the position automatically, not last-traded price. |
| Leverage compresses your buffer | At 10× leverage, a 9.5% adverse move can liquidate a long; at 50×, normal intraday noise is enough. |
| Calculate before you trade | Use the long/short liquidation formula manually and compare it to the exchange estimate before entering. |
| Isolated margin limits blast radius | Use isolated margin for speculative trades so one liquidation cannot drain your entire account. |
| Size by account risk | Risk no more than 1–2% of total equity per trade; a full liquidation at that sizing is survivable. |
For ongoing liquidation alerts, open-interest data, and market analysis, follow Blockchainreporter daily.
Table of Contents
- How does margin and leverage actually work in crypto?
- When does liquidation actually get triggered?
- How exchanges actually execute a forced liquidation
- Why liquidation cascades can move the entire market
- How to calculate your liquidation price step by step
- Practical strategies to avoid getting liquidated
- Tools traders use to monitor liquidation risk
- Blockchainreporter analysis: lessons from major liquidation events
- What to do immediately after a liquidation
- The part of liquidation risk most traders ignore
- Sources
How does margin and leverage actually work in crypto?
Margin is the collateral you post to open a leveraged position. Leverage multiplies your exposure beyond what that collateral alone could buy. Two margin figures matter most.
Initial margin is the minimum deposit required to open the position. Maintenance margin is the lower threshold your account equity must stay above to keep the position open. The moment your equity falls to or below maintenance margin, the risk engine flags the position for liquidation.
Mark price is the index-based fair-value price the exchange uses to measure your unrealized profit and loss. It is typically a weighted composite of major spot markets, not the last trade on that exchange. This matters because a single large trade on a thin order book cannot spike the mark price and trigger a wave of liquidations artificially. Exchanges publish their mark-price algorithms in their margin or API documentation, and the MetaMask Help Center’s leverage and liquidation guide explains this construction clearly for perpetual contracts.
Isolated vs. cross margin
With isolated margin , only the collateral you assign to that specific position is at risk. If the position is liquidated, the rest of your account is untouched. This is the right choice for speculative trades where you want a defined maximum loss.
With cross margin , your entire account balance acts as collateral for all open positions. A losing trade draws from the same pool as your winning ones, which can prevent liquidation longer but also means one bad position can drain your whole account.
How leverage shrinks your buffer
Higher leverage compresses the distance between your entry price and your liquidation price. At 100×, you have almost no buffer at all. The table below illustrates approximate adverse-move tolerances under common maintenance-margin assumptions.
At 10× leverage, a roughly 9.5% adverse move can liquidate a long under common maintenance-margin assumptions. At 50× or 100×, normal intraday noise is enough.
When does liquidation actually get triggered?
The trigger is precise: your margin balance, measured against the mark price, falls to or below the maintenance margin. The exchange risk engine checks this continuously, not just at settlement.
Here is the sequence of conditions that lead to that moment:
- You open a leveraged position and post initial margin.
- Price moves against you. Your unrealized loss reduces your effective margin balance.
- The exchange calculates your margin ratio: margin balance divided by position notional value.
- When that ratio reaches the maintenance margin rate (for example, 0.5% on a standard perpetual), the risk engine flags the position.
- Liquidation is initiated using the mark price at that moment, not the last traded price.
Long vs. short liquidation price
For a long position , your liquidation price is below your entry. Price has to fall far enough to erase your margin. For a short position , your liquidation price is above your entry. Price has to rise far enough to do the same damage.
In plain terms:
- Long liquidation price ≈ Entry price × (1 − 1/Leverage + Maintenance Margin Rate)
- Short liquidation price ≈ Entry price × (1 + 1/Leverage − Maintenance Margin Rate)
Funding payments shift these levels over time. If you hold a long in a high positive-funding environment, each funding interval chips away at your margin balance, nudging your liquidation price upward. That is a risk most traders underestimate when holding positions overnight.
Mark price is used specifically to reduce manipulation risk. Because it is derived from a weighted composite of major spot markets, a single actor cannot spike the last-traded price on one exchange to trigger mass liquidations.
How exchanges actually execute a forced liquidation
Once the risk engine flags your position, the process moves fast. Understanding the sequence helps you know what fees you will face and what, if anything, you might recover.
Step 1: Partial liquidation attempt. Most major exchanges try to reduce your position size first rather than closing it entirely. The goal is to bring your margin ratio back above the maintenance threshold with minimal disruption. If a partial reduction restores the ratio, the process stops there.
Step 2: Full closure. If partial reduction fails, the exchange closes the entire position at market. The fill price you receive is whatever the order book provides at that moment, which may be worse than the displayed liquidation price during fast-moving markets.
Step 3: Bankruptcy price and insurance fund. The bankruptcy price is the level at which your losses exceed your posted collateral entirely. If the market fills your liquidation order below the bankruptcy price (for a long) or above it (for a short), the exchange faces a shortfall. The insurance fund covers that gap. Most major exchanges maintain a dedicated insurance fund funded by liquidation fees collected from traders whose positions close above the bankruptcy price.
Step 4: Auto-Deleveraging (ADL). When the insurance fund is insufficient, the exchange activates ADL. This system automatically reduces the positions of the most profitable traders on the opposite side of the market to cover the shortfall. If you are in a highly profitable short position during a long-liquidation cascade, ADL can close part of your position without warning. Exchanges add explicit liquidation fees and may use ADL when the insurance fund cannot cover bankruptcies. ADL is rare but real, and it is worth checking where your account ranks on the ADL priority queue before holding large positions.
What you get back, if anything, depends on whether your collateral exceeded the bankruptcy price at fill. Any remaining balance above the bankruptcy price is typically returned to your account, minus the liquidation fee. Many traders are surprised to find a small residual balance after liquidation for this reason.
Why liquidation cascades can move the entire market
A single liquidation is a private event between one trader and one exchange. A cascade is a market-structure event that can move prices by double digits in minutes.
The mechanism is straightforward. Leveraged positions cluster at predictable price levels because traders using similar leverage ratios and entry points share similar liquidation prices. When price reaches one cluster, those forced closures push price further in the same direction, into the next cluster, triggering more liquidations, and so on. Liquidation cascades occur when forced closures push price across clustered liquidation zones, producing self-reinforcing sell or buy pressure that rapidly triggers additional forced exits.
Long squeezes and short squeezes
A long squeeze happens when price drops sharply, liquidating leveraged longs. Their forced sell orders add selling pressure, accelerating the decline. A short squeeze is the mirror: price rises, liquidating leveraged shorts, whose forced buy orders push price even higher. Both dynamics are amplified by thin order books, where even modest notional volume can move price significantly.
Open interest is the leading indicator here. Rising open interest alongside extreme funding rates signals that one side of the market is heavily leveraged and exposed. When a catalyst hits, that leverage unwinds fast.
Blockchainreporter analysis: Multi-billion-dollar daily liquidation events have occurred in crypto markets and materially reduced open interest within 24 hours, as CoinDesk Data documented during the largest single-day liquidation event on record. The speed of open-interest collapse during those events reflects how quickly clustered leverage can unwind when a single price level breaks.
Macro headlines can also spark the initial catalyst. When Tesla announced it was suspending Bitcoin purchases in May 2021, the resulting liquidity gap triggered concentrated liquidations across leveraged long positions, amplifying the price drop well beyond what the fundamental news alone would have justified. Blockchainreporter’s daily market coverage tracks these macro-to-liquidation linkages in real time.
How to calculate your liquidation price step by step
Before you open any leveraged trade, you should be able to compute your liquidation price manually. The exchange-displayed estimate is a useful guide, but it can differ from the actual fill because of slippage, fees, funding payments, and tiered maintenance-margin rates.
Inputs you need
- Entry price
- Leverage (or initial margin rate = 1/Leverage)
- Maintenance margin rate (MMR) for your position size tier
- Position side (long or short)
- Any open fees or funding assumptions
The formulas
Long liquidation price:
Liq Price (Long) = Entry Price × (1 − Initial Margin Rate + MMR)
Short liquidation price:
Liq Price (Short) = Entry Price × (1 + Initial Margin Rate − MMR)
Worked example
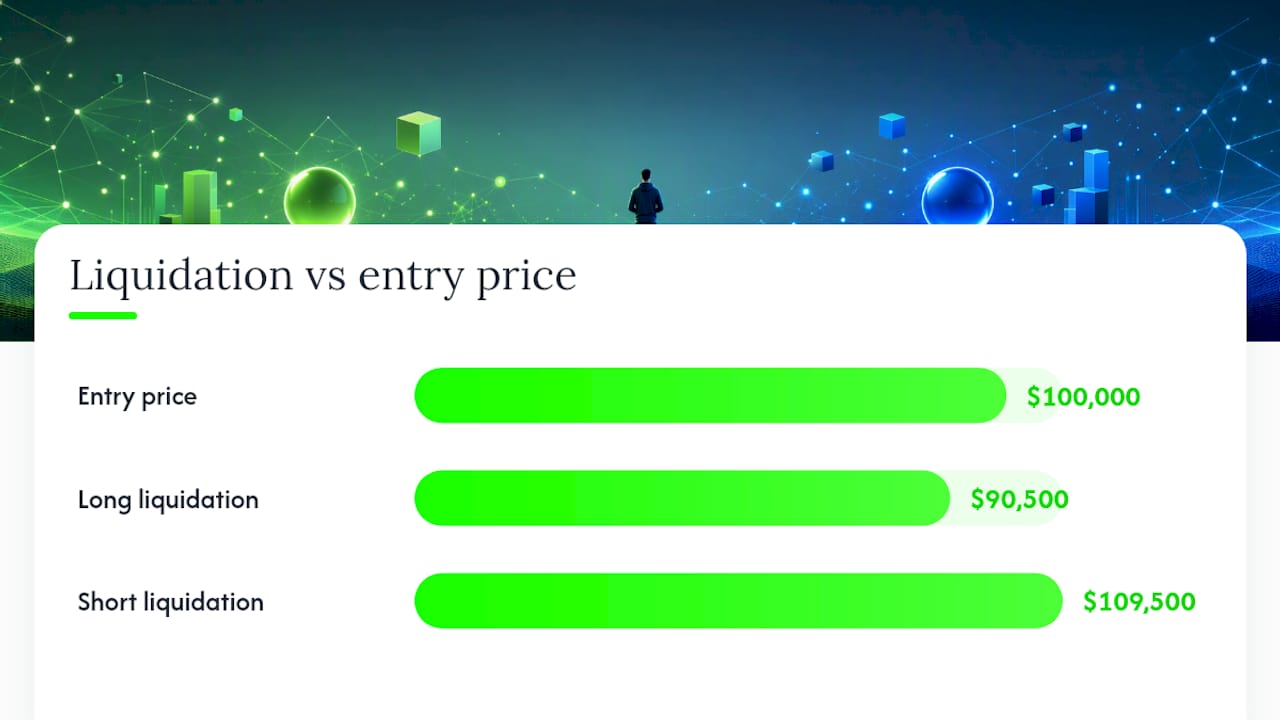
You open a long on Bitcoin at $100,000 with 10× leverage.
Long liquidation price = $100,000 × (1 − 0.10 + 0.005) = $100,000 × 0.905 = $90,500
Now the same trade as a short:
Short liquidation price = $100,000 × (1 + 0.10 − 0.005) = $100,000 × 1.095 = $109,500
| Parameter | Long Example | Short Example |
|---|---|---|
| Entry price | $100,000 | $100,000 |
| Leverage | 10× | 10× |
| Initial margin rate | 10% | 10% |
| Maintenance margin rate | 0.5% | 0.5% |
| Liquidation price | $90,500 | $109,500 |
| Adverse move to liquidation | 9.5% | 9.5% |
The exchange-displayed liquidation price may show a slightly different number because most platforms apply tiered MMR (higher rates for larger notionals), include the opening fee in the margin calculation, and factor in any accrued funding. Treat the manual calculation as a floor check and the exchange display as the operational number, but verify both before entering.
Practical strategies to avoid getting liquidated
The single most repeatable tactic across all exchanges is sizing positions from an account-risk perspective and keeping buffer collateral. Everything else is secondary.
Core controls:
- Use lower leverage. Most retail liquidations cluster at high leverage, per KuCoin’s liquidation data. Staying at 5× or below gives you enough room to survive normal volatility without constant monitoring.
- Set a stop-loss well before your liquidation price. A practical rule: place your stop at least 30–50% of the distance between your entry and your liquidation price. If your liquidation is at $90,500 and your entry is $100,000, a stop at $95,000–$96,500 exits you with a manageable loss.
- Use isolated margin for speculative trades. It caps your maximum loss at the collateral assigned to that position.
- Maintain a collateral buffer. Keep 20–30% of your trading capital in reserve, available to add to positions if price moves against you.
- Size by account risk, not by position size. Risk no more than 1–2% of total account equity on any single trade. At that sizing, even a full liquidation is survivable.
Tactical behaviors:
- Set price alerts at 5% and 10% above your liquidation price so you get a warning before the risk engine does.
- Pre-plan your add-collateral rule: decide in advance at what price you will add funds, and how much. Making that decision under pressure leads to averaging into losing trades.
- Scale out of positions as they move in your favor. Reducing size locks in gains and raises your effective margin ratio simultaneously.
- Monitor funding rates. Persistently high positive funding on a long position means you are paying a recurring cost that erodes your margin buffer every eight hours.
Pre-trade checklist:
- Calculated liquidation price manually? ✓
- Stop-loss set above liquidation price? ✓
- Position sized to risk 1–2% of account? ✓
- Collateral buffer reserved? ✓
- Funding rate checked? ✓
- Mark-price alert set? ✓
Pro Tip: *Set your alerts to the mark price feed, not the last-traded price.
Tools traders use to monitor liquidation risk
No single tool covers everything. The most effective monitoring setup combines a few complementary data sources.
Liquidation maps and heatmaps show where large clusters of liquidation orders sit across price levels. These tools pull open interest and estimated liquidation prices from exchange APIs to visualize where cascades are likely to accelerate. When price approaches a dense cluster, that zone acts as a magnet: price often moves through it quickly as forced orders execute.
Open interest trackers measure the total notional value of outstanding contracts. Rising open interest alongside a trending price means new leveraged money is entering. Falling open interest after a sharp move usually confirms that liquidations have cleared. Watching the rate of change matters as much as the absolute level.
Funding rate monitors show the periodic payment between longs and shorts on perpetual contracts. Extreme positive funding (longs paying shorts) signals that the long side is crowded and overleveraged. Extreme negative funding signals the opposite. Either extreme raises cascade risk.
Mark-price index pages are published by every major exchange in their API or margin documentation. Checking the mark price directly, rather than relying on the chart’s last-traded price, gives you the number the risk engine actually uses.
Exchange position viewers show your real-time margin ratio, estimated liquidation price, and unrealized P&L. Keep this open on a second screen or a mobile alert app when you hold overnight positions.
A minimal monitoring stack for U.S. traders
For a U.S.-based trader holding perpetual futures positions, a practical setup looks like this: liquidation heatmap on one screen, funding rate monitor alongside it, and exchange position viewer with mark-price alerts set on mobile. When you see rising open interest, extreme funding in one direction, and price approaching a dense liquidation cluster simultaneously, that is a high-risk environment. Reduce size or tighten stops before the cascade starts, not after.
Note that some advanced derivatives data tools restrict access for U.S. users due to regulatory constraints. Always verify that any platform you use for data or trading is accessible and compliant in your jurisdiction.
Blockchainreporter analysis: lessons from major liquidation events
The mechanics of liquidation cascades are best understood through events where the theory played out at scale.
The pattern in major cascade events is consistent. A catalyst (macro news, a large token unlock, or an institutional flow shift) pushes price into a dense liquidation cluster. Forced sell orders from those liquidations push price into the next cluster. Thin order books during off-peak hours mean each wave of forced orders moves price more than it would during liquid trading sessions. Open interest collapses as leveraged positions are wiped out, and the market reprices to a level where remaining participants are less leveraged and more willing to hold.
The Hyperliquid perpetual DEX market’s $218 billion in trading volume in a single month illustrates how much leveraged activity now flows through decentralized venues, where liquidation mechanics and insurance fund structures differ from centralized exchanges. On-chain liquidations are visible in real time via blockchain explorers, giving traders a transparency advantage that centralized exchange data does not always provide.
Practical lessons from cascade events:
- The largest losses in cascade events fall on traders who held high leverage through a period of rising open interest and extreme funding, then failed to reduce before the break.
- Macro catalysts rarely give advance notice. Positions sized for normal volatility get destroyed by tail events. The macro-to-liquidation link is real and recurring.
- Liquidity bots and algorithmic liquidation engines accelerate the cascade. They do not wait for human decision-making. By the time you see the price move on your chart, the first wave of liquidations may already be complete.
What to do immediately after a liquidation
Getting liquidated is not the end of your trading account. The steps you take in the next 30 minutes determine how much you recover and whether you repeat the mistake.
- Check your transaction history. Confirm the liquidation price, the fee charged, and any remaining balance returned to your account. Most exchanges return collateral above the bankruptcy price minus the liquidation fee.
- Save exchange logs and screenshots. Download your trade history and position summary immediately. Exchanges sometimes purge detailed logs after 30–90 days, and you will need this for tax records.
- Confirm your returned balance. Verify the amount credited back to your account matches what the exchange’s liquidation summary shows. Discrepancies are rare but worth catching early.
- Record the event for tax purposes. In the United States, a liquidation is a taxable disposition. The loss is typically calculated as the difference between your cost basis and the liquidation proceeds. Consult a tax professional familiar with crypto for your specific situation, as rules can vary.
- File a dispute if the numbers do not add up. Most exchanges have a support ticket system for liquidation disputes. Provide your saved logs and screenshots. Disputes over slippage or incorrect liquidation prices are occasionally resolved in the trader’s favor, but only when documentation is clear.
- Journal the trade. Write down your entry rationale, the leverage used, where your stop was (or was not), and what you would do differently. This is not self-punishment. It is the only way to extract information from a loss.
- Take a break before re-entering. Emotional re-entry after a liquidation, especially at higher leverage to “make it back,” is one of the most common paths to a second liquidation in the same session.
The exchange-displayed estimated liquidation price should be treated as an operational guide, not a guarantee. If your actual fill was significantly worse than the displayed price, document it and check whether the exchange’s fill quality matches their stated liquidation policy.
Psychologically, treat a liquidation as data, not as a verdict on your ability. The position was wrong, or the sizing was wrong, or both. Neither conclusion requires self-criticism beyond the journal entry. What it does require is a concrete process change before the next trade.
The part of liquidation risk most traders ignore
The conventional framing of liquidation risk focuses on leverage. Use less leverage, the advice goes, and you will be fine. That is true as far as it goes, but it misses the more dangerous variable: position sizing relative to account equity.
The leverage number is visible and feels controllable. The account-risk percentage is less intuitive and almost never displayed prominently on exchange interfaces.
The second thing traders consistently underestimate is the cost of funding in high-leverage environments. Perpetual funding rates can run at annualized rates that erode margin meaningfully over days, not weeks. A position that looks safe at open can drift toward its liquidation price purely from funding costs, with no adverse price move at all. Monitoring funding is not optional for anyone holding positions longer than a few hours.
Blockchainreporter covers low-volatility risk misconceptions that apply directly here: a quiet market can lull traders into oversizing, and the liquidation cascade that follows a volatility spike hits hardest when positions are largest.
The traders who survive long enough to compound returns are not the ones who avoid losses entirely. They are the ones who size positions so that no single liquidation is catastrophic, keep stops in place, and treat every forced exit as a tuition payment rather than a disaster.
Sources
The following authoritative sources were cited in this guide and are worth bookmarking for ongoing reference:
- Crypto Liquidation Explained: Mechanics, Triggers, and Essential Risk Management Strategies | KuCoin
- Understanding leverage and liquidation | MetaMask Help Center
This article is general information, not financial or tax advice. Confirm current exchange rules and consult a qualified professional for your specific situation.
This article is general information, not a substitute for advice from a qualified financial advisor. Consult a qualified financial professional about your own circumstances before acting on anything here.
Recommended
- Hyperliquid Leads July Perpetual DEX Market With $218B Trading Volume
- Hyperliquid ETF Inflows Stall As Competition Mounts, JPMorgan Data Shows
- HTX Turns Negative Fees On TradFi Assets Into A Competitive Weapon
- Bitcoin’s Low Volatility Doesn’t Mean Low Risk