


XRP closes above $0.979 and Solana gains 5% as PUMP sets a 90-day low. November 18 crypto price analysis tracks key levels for ETH, XRP, SOL, INJ and PUMP.
| Asset | Latest USD price | Past 24 hours | Market-wide 24h volume | Market-cap rank |
|---|---|---|---|---|
| Ethereum (ETH) | $1,807.68 | −1.34% | $11.88 billion | 2 |
| XRP | $0.981954 | +1.95% | $1.57 billion | 6 |
| Solana (SOL) | $75.11 | +3.13% | $3.04 billion | 7 |
| Injective (INJ) | $7.31 | −0.20% | $123.85 million | 80 |
| Pump.fun (PUMP) | $0.00267819 | −4.08% | $98.18 million | 63 |
Ethereum Gains Just $3 Despite a $93 Trading Range
Ethereum traded between $1,749.17 and $1,841.74 on Tuesday but finished at $1,822.90, just $3.31 above Monday’s close. By Wednesday morning, ETH had eased to $1,807.68, down 0.92% from the $1,824.48 recorded in Monday’s Ethereum analysis .
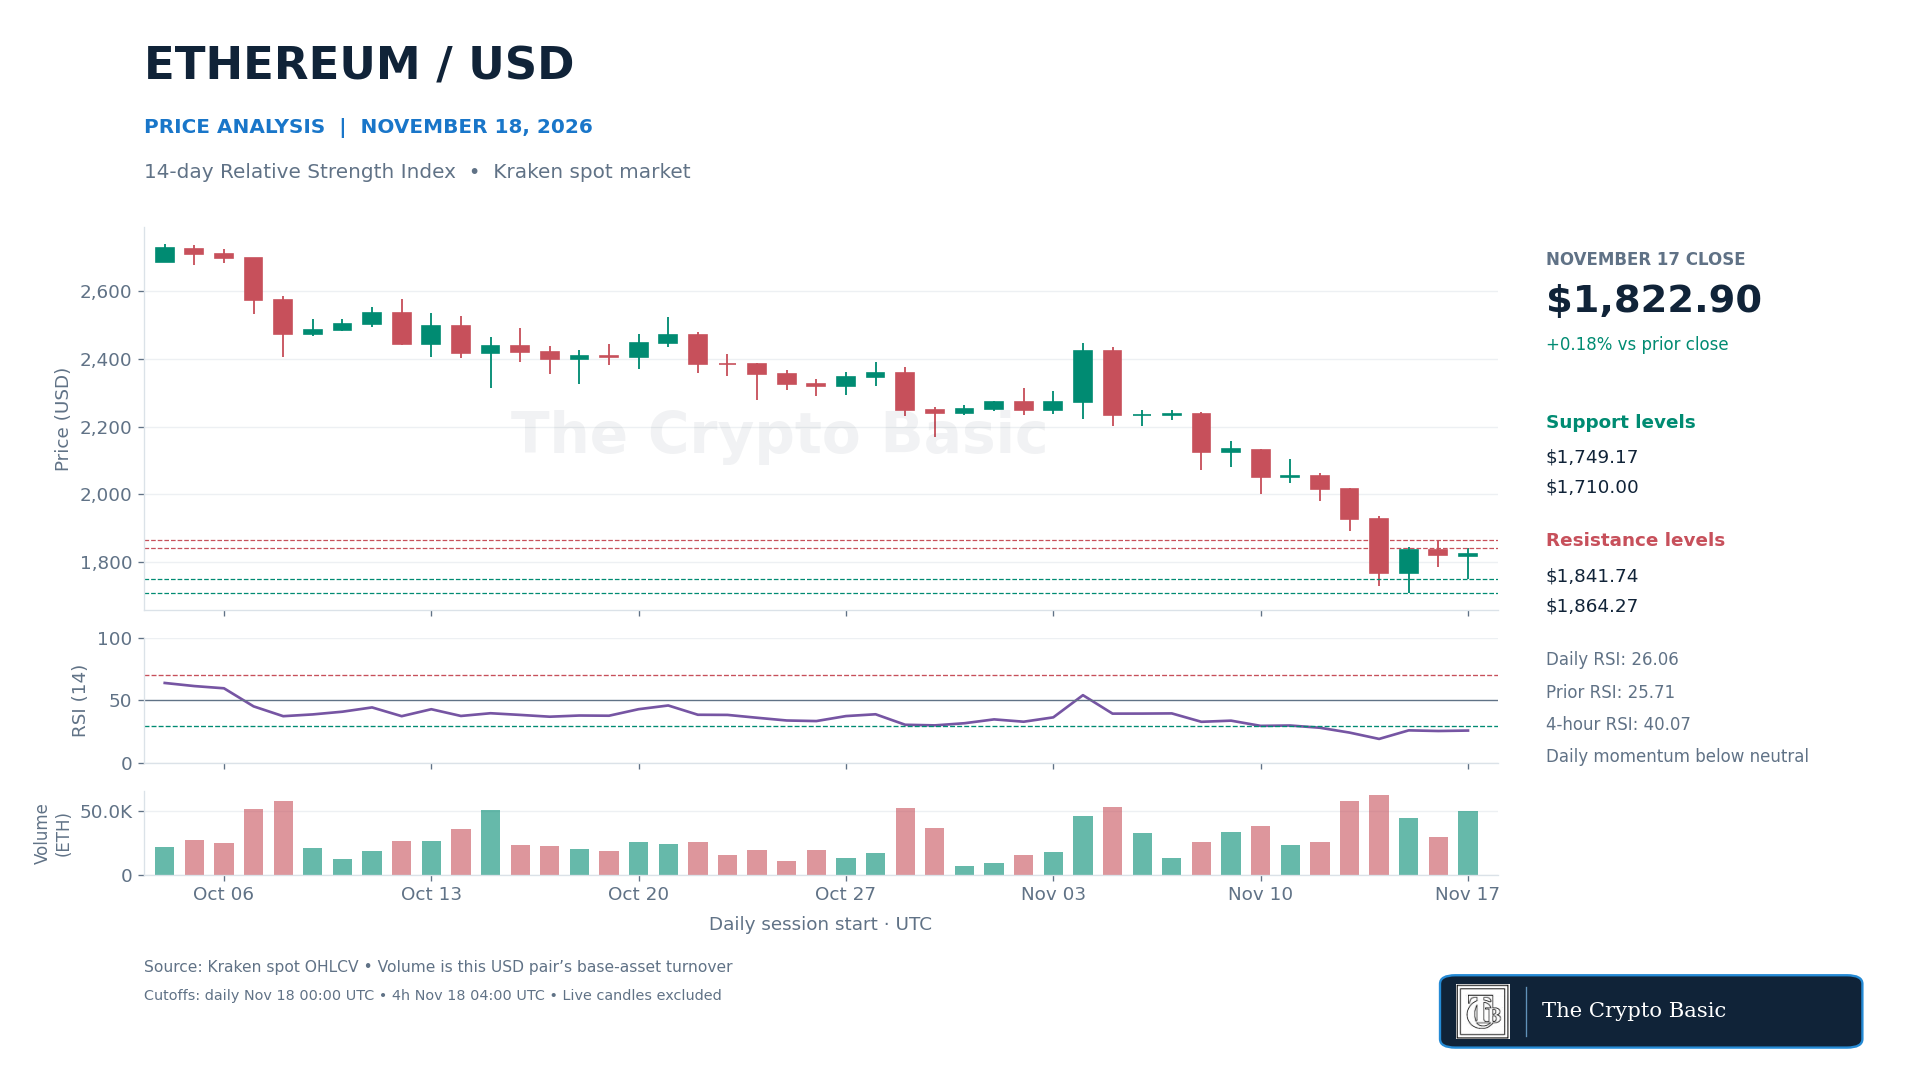
The 14-day relative strength index edged up from 25.71 to 26.06. That marked a sixth consecutive close below the oversold threshold of 30. The four-hour RSI was firmer at 40.07, although ETH ended that session at $1,803.21, about $20 below Tuesday’s close.
A daily close above $1,841.74 would clear Tuesday’s high and bring Monday’s $1,864.27 high into view. A close below $1,749.17 would put Sunday’s $1,710 low back under pressure.
XRP Clears Sunday’s High but Struggles to Hold it as Support
XRP climbed 2.95% on Tuesday to close at $0.98260. That cleared the $0.97914 level identified in Tuesday’s XRP analysis . Buyers also stepped in at $0.94500, above Monday’s $0.94005 low.
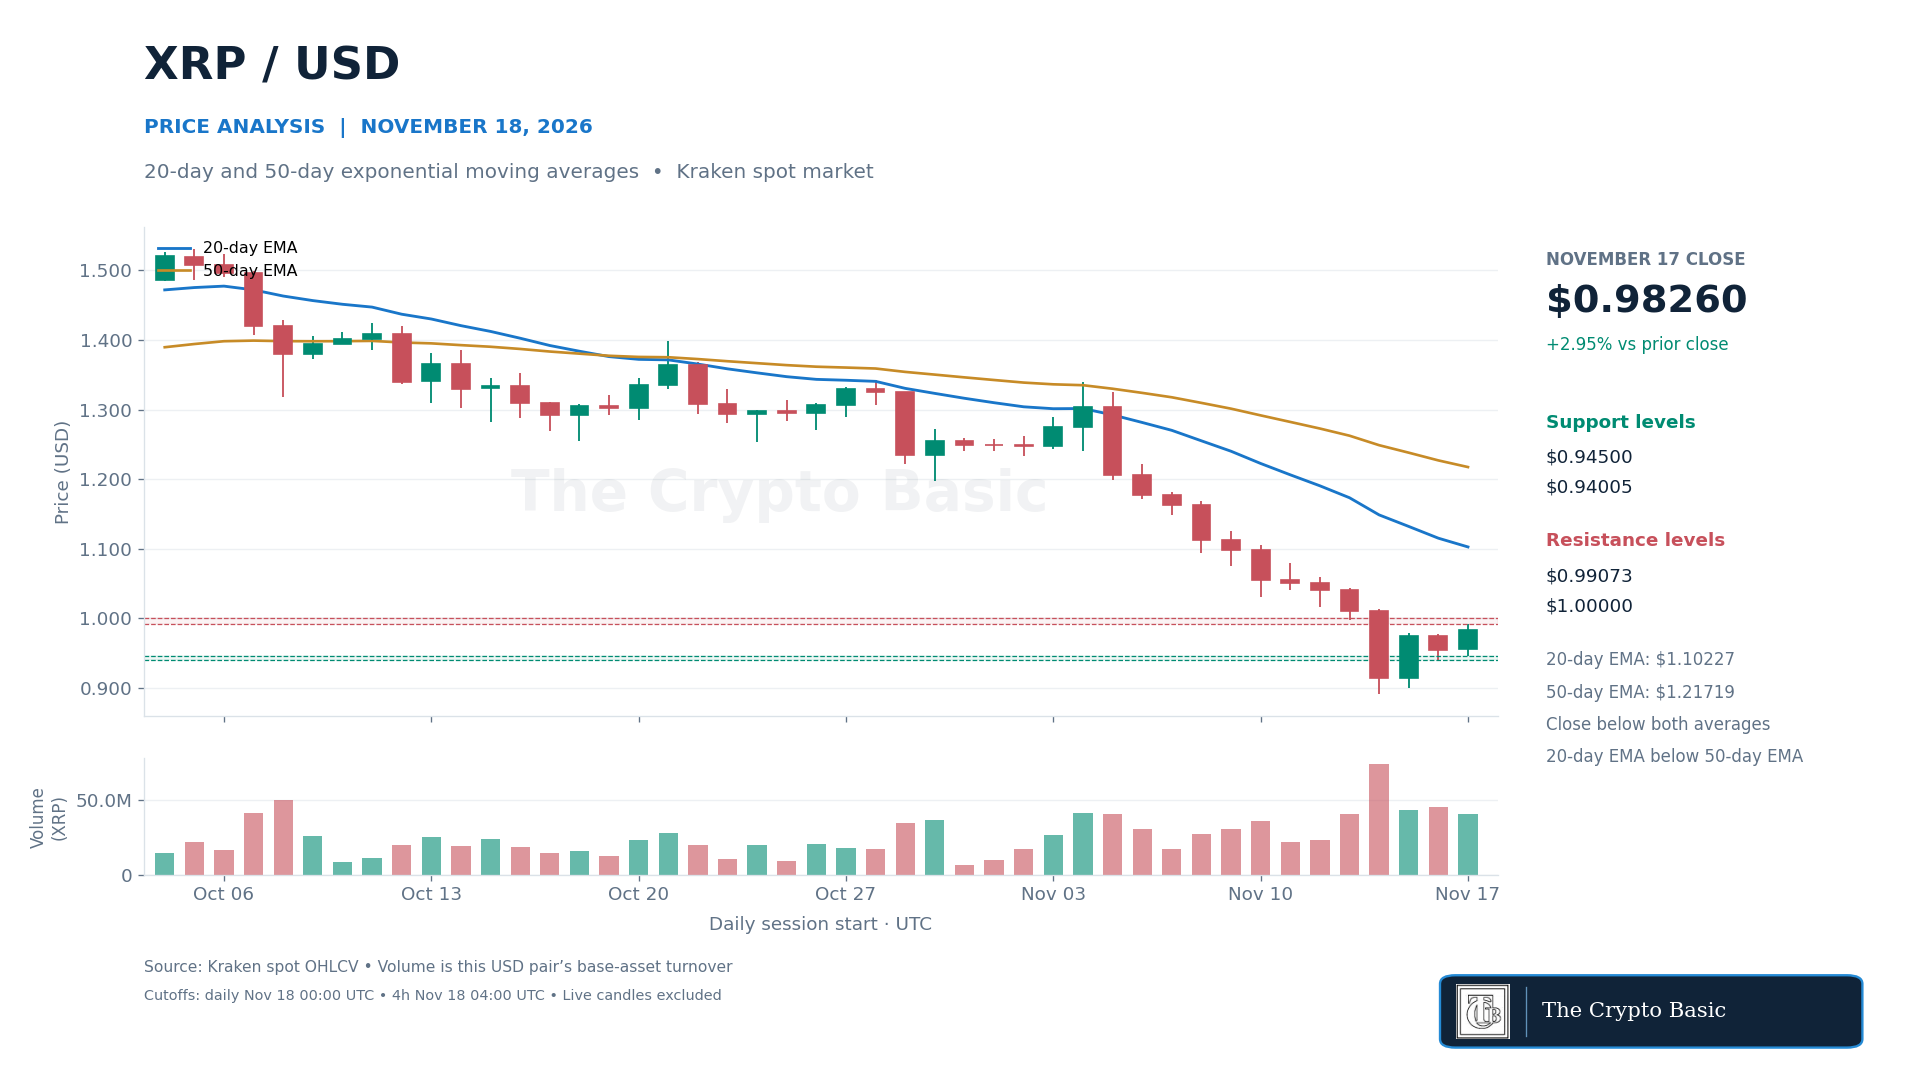
Wednesday’s first four-hour candle closed back below $0.97914 at $0.97631 before XRP recovered to $0.981954. Buyers have yet to establish Sunday’s high as support. Overhead, the 20-day exponential moving average fell to $1.10227 and the 50-day average to $1.21719. Both continued to slope lower despite Tuesday’s gain.
A daily close above Tuesday’s $0.99073 high would put $1 within reach. On the downside, a close below $0.94500 would break Tuesday’s higher low and expose $0.94005.
Solana Gains 5% as Volume Rises Above its 20-Day Average
Solana rose 5.03% on Tuesday, from $71.51 to $75.11, finishing above Sunday’s $73.24 high. About 343,840 SOL changed hands on Kraken’s USD pair, 16% above the average of 296,831 SOL over the preceding 20 sessions.
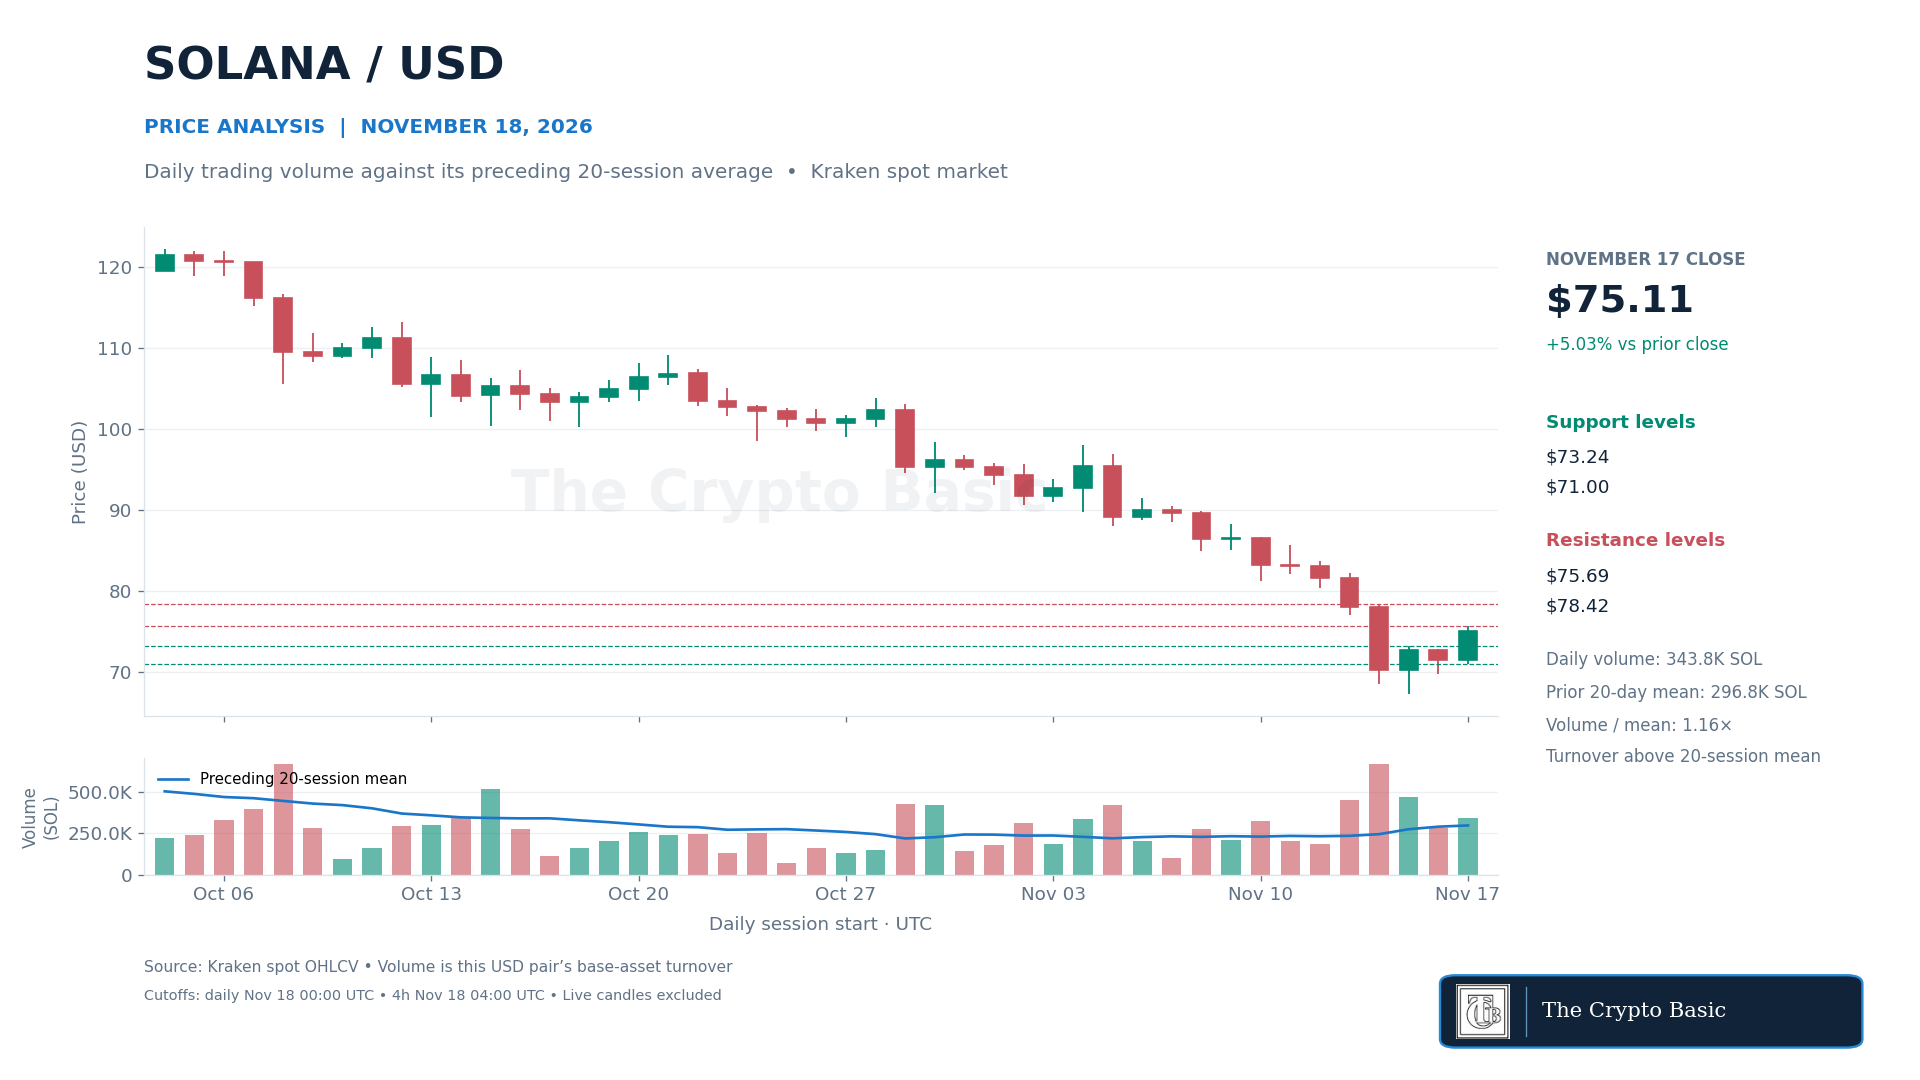
The first four-hour pullback on Wednesday reached $73.98 and closed at $74.71. Buyers held the previous resistance on its first test from above. At $75.11 later that morning, SOL was still about 12.4% below the $85.73 recorded in the November 10 Solana analysis .
A close above Tuesday’s $75.69 high would bring Saturday’s $78.42 high into view. A daily close back below $73.24 would weaken the breakout, leaving Tuesday’s $71 low as the next support.
Injective Rallies 7.6% but Gives Up its Bollinger Midpoint
Injective rose from $6.898 to $7.425 on Tuesday. At the session high of $7.729, INJ had cleared the midpoint of its daily Bollinger Bands. By the close, it had slipped back below that 20-day average, which fell from $7.594 to $7.558.
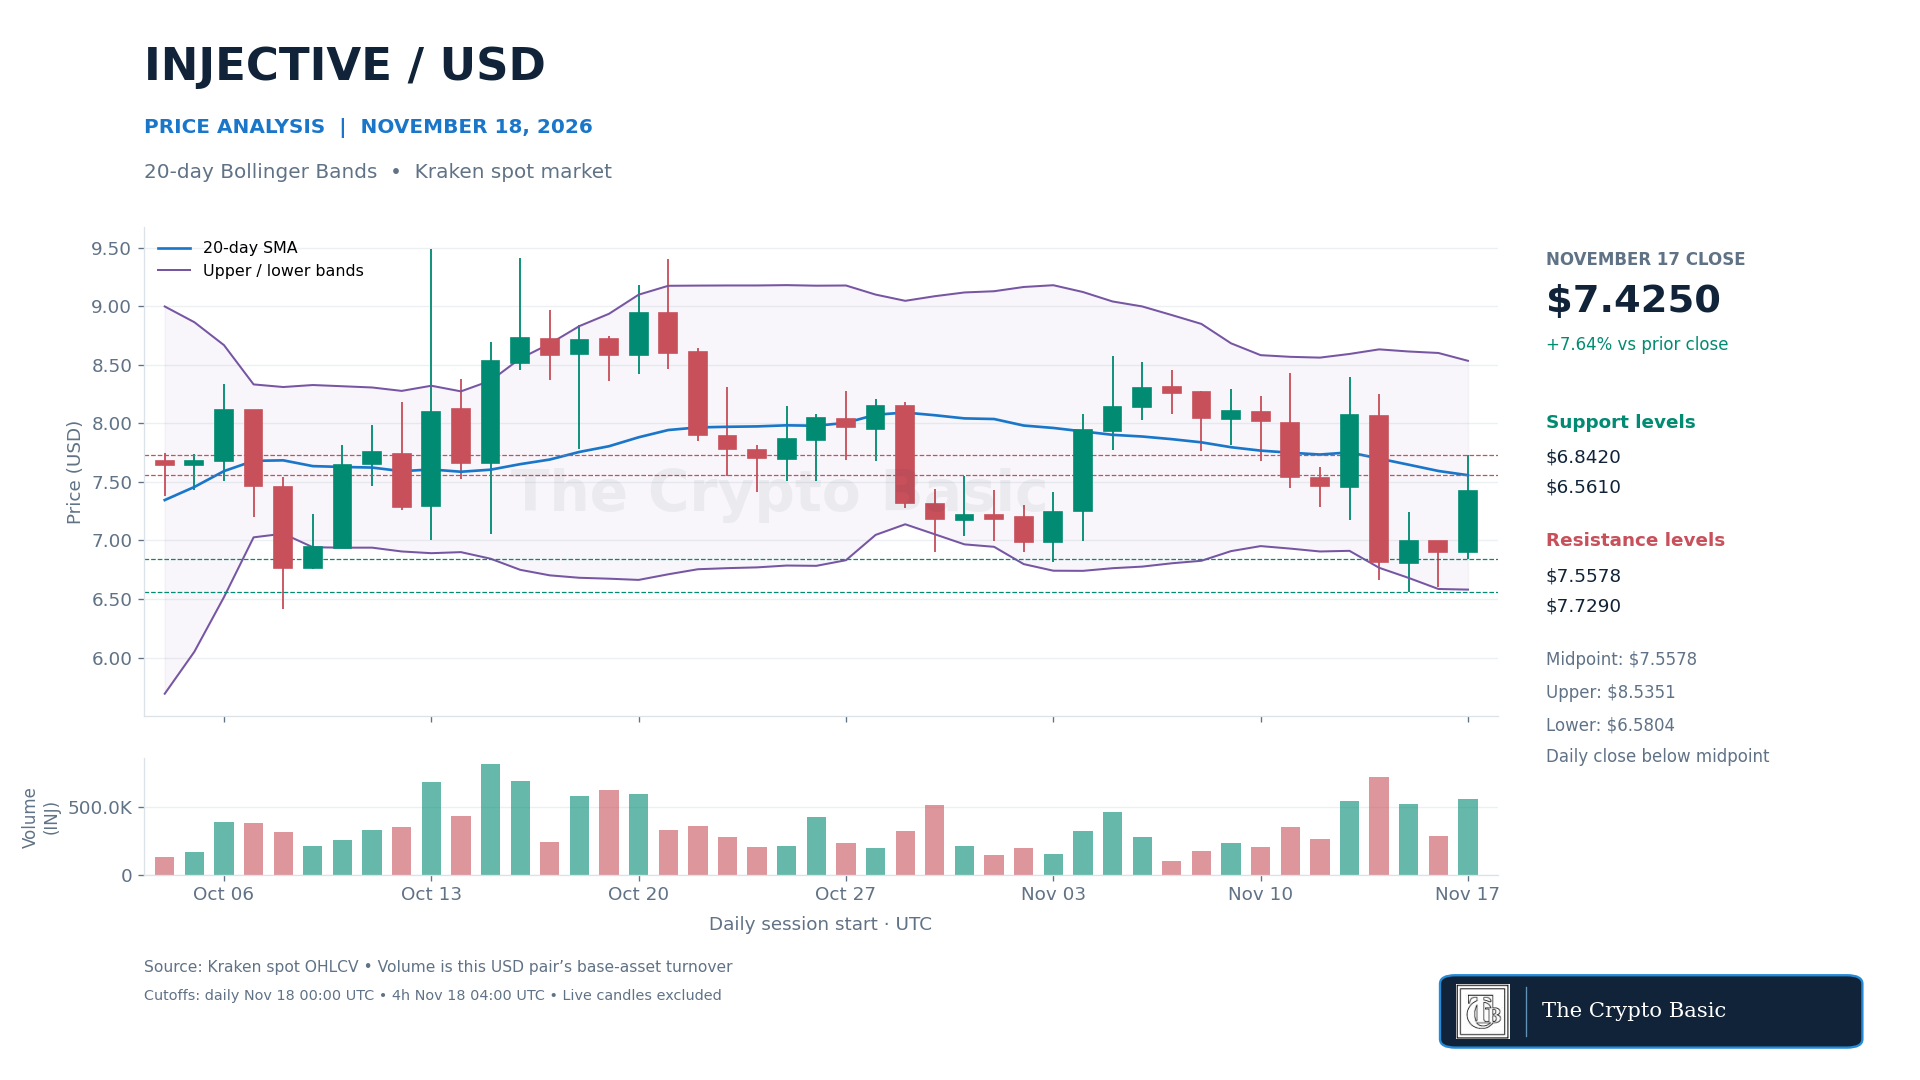
The four-hour chart showed buyers in a stronger position. INJ closed at $7.317, above the four-hour midpoint at $7.032. Even so, Wednesday’s $7.31 quote was roughly 13% below the $8.36 recorded in the November 6 Injective analysis .
A daily close above $7.558 would strengthen the recovery. Clearing $7.729 would then bring Friday’s $8.074 close into view. A loss of Tuesday’s $6.842 low would expose a narrow support area between the $6.580 lower band and Sunday’s $6.561 low.
PUMP Returns to Support After Setting a 90-Day Low
PUMP fell to $0.002647 on Tuesday, its lowest price in 90 completed sessions. Buyers lifted it to $0.002819 by the close, limiting the daily decline to 0.49%. Much of that recovery faded early Wednesday. The first four-hour candle reached $0.002668 and closed at $0.002697.
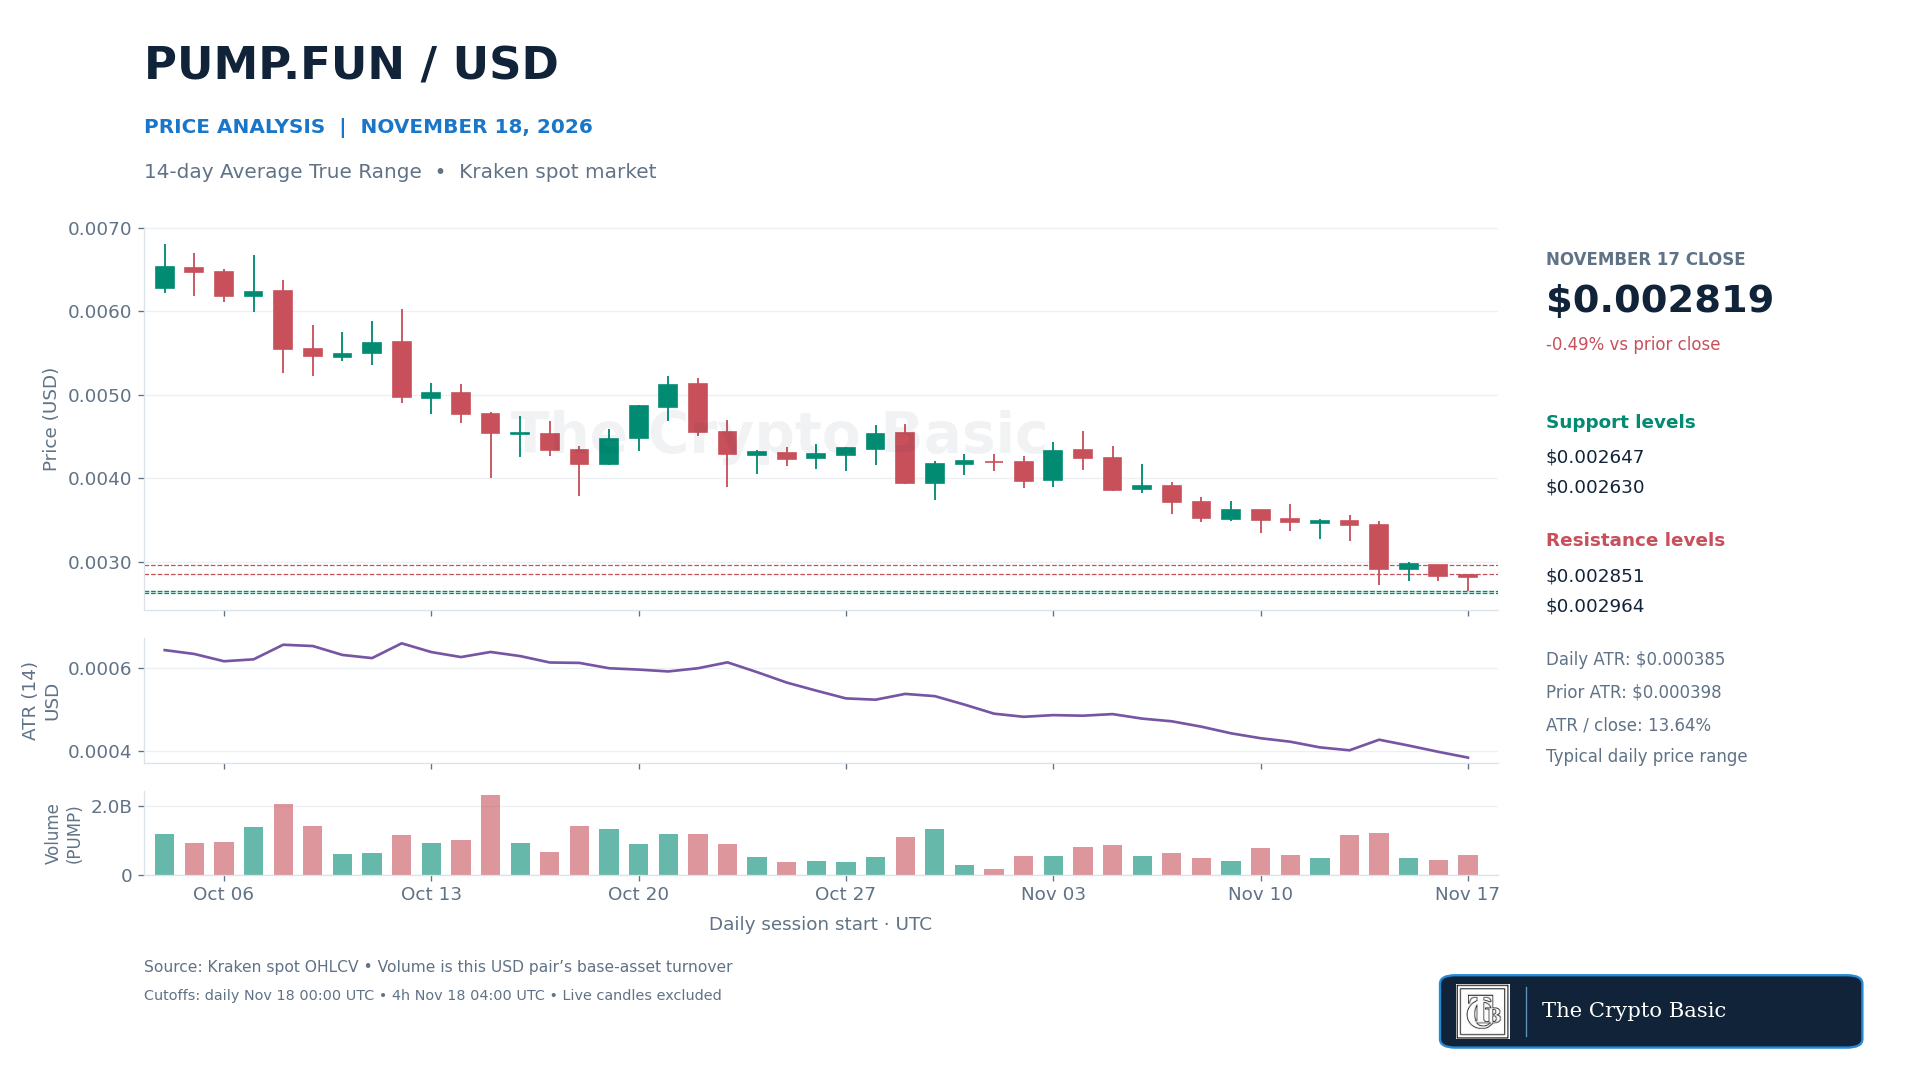
The 14-day average true range eased from $0.000398 to $0.000385. That was still 13.64% of Tuesday’s close. By Wednesday morning, PUMP traded at $0.00267819, just 1.18% above Tuesday’s low. That left little room above support relative to its recent daily swings.
A daily close below $0.002647 would bring the August 12 low at $0.002630 into view. A close above Tuesday’s $0.002851 high would ease the immediate selling pressure, with Monday’s $0.002964 high the next recovery test.