Solana (SOL) Jumps 10%, Bulls Set Sights on a $200 Breakout


Solana started a fresh increase from the $175 zone. SOL price is now up nearly 10% and might aim for more gains above the $200 zone.
- SOL price started a fresh upward move above the $185 and $190 levels against the US Dollar.
- The price is now trading above $192 and the 100-hourly simple moving average.
- There was a break above a bearish trend line with resistance at $178 on the hourly chart of the SOL/USD pair (data source from Kraken).
- The pair could extend gains if it clears the $200 resistance zone.
Solana Price Starts Fresh Surge
Solana price started a decent increase after it found support near the $175 zone, like Bitcoin and Ethereum . SOL climbed above the $180 level to enter a short-term positive zone.
The price even smashed the $192 resistance. There was a break above a bearish trend line with resistance at $178 on the hourly chart of the SOL/USD pair. The bulls were able to push the price above the $195 barrier. A high was formed at $199 and the price is now consolidating gains above the 23.6% Fib retracement level of the upward move from the $173 swing low to the $199 high.
Solana is now trading above $192 and the 100-hourly simple moving average. On the upside, the price is facing resistance near the $200 level. The next major resistance is near the $202 level.
Source: SOLUSD on TradingView.com The main resistance could be $205. A successful close above the $205 resistance zone could set the pace for another steady increase. The next key resistance is $212. Any more gains might send the price toward the $220 level.
Are Downsides Supported In SOL?
If SOL fails to rise above the $200 resistance, it could start another decline. Initial support on the downside is near the $194 zone. The first major support is near the $186 level or the 50% Fib retracement level of the upward move from the $173 swing low to the $199 high.
A break below the $186 level might send the price toward the $180 support zone. If there is a close below the $180 support, the price could decline toward the $175 support in the near term.
Technical Indicators
Hourly MACD – The MACD for SOL/USD is gaining pace in the bullish zone.
Hourly Hours RSI (Relative Strength Index) – The RSI for SOL/USD is above the 50 level.
Major Support Levels – $194 and $186.
Major Resistance Levels – $200 and $212.
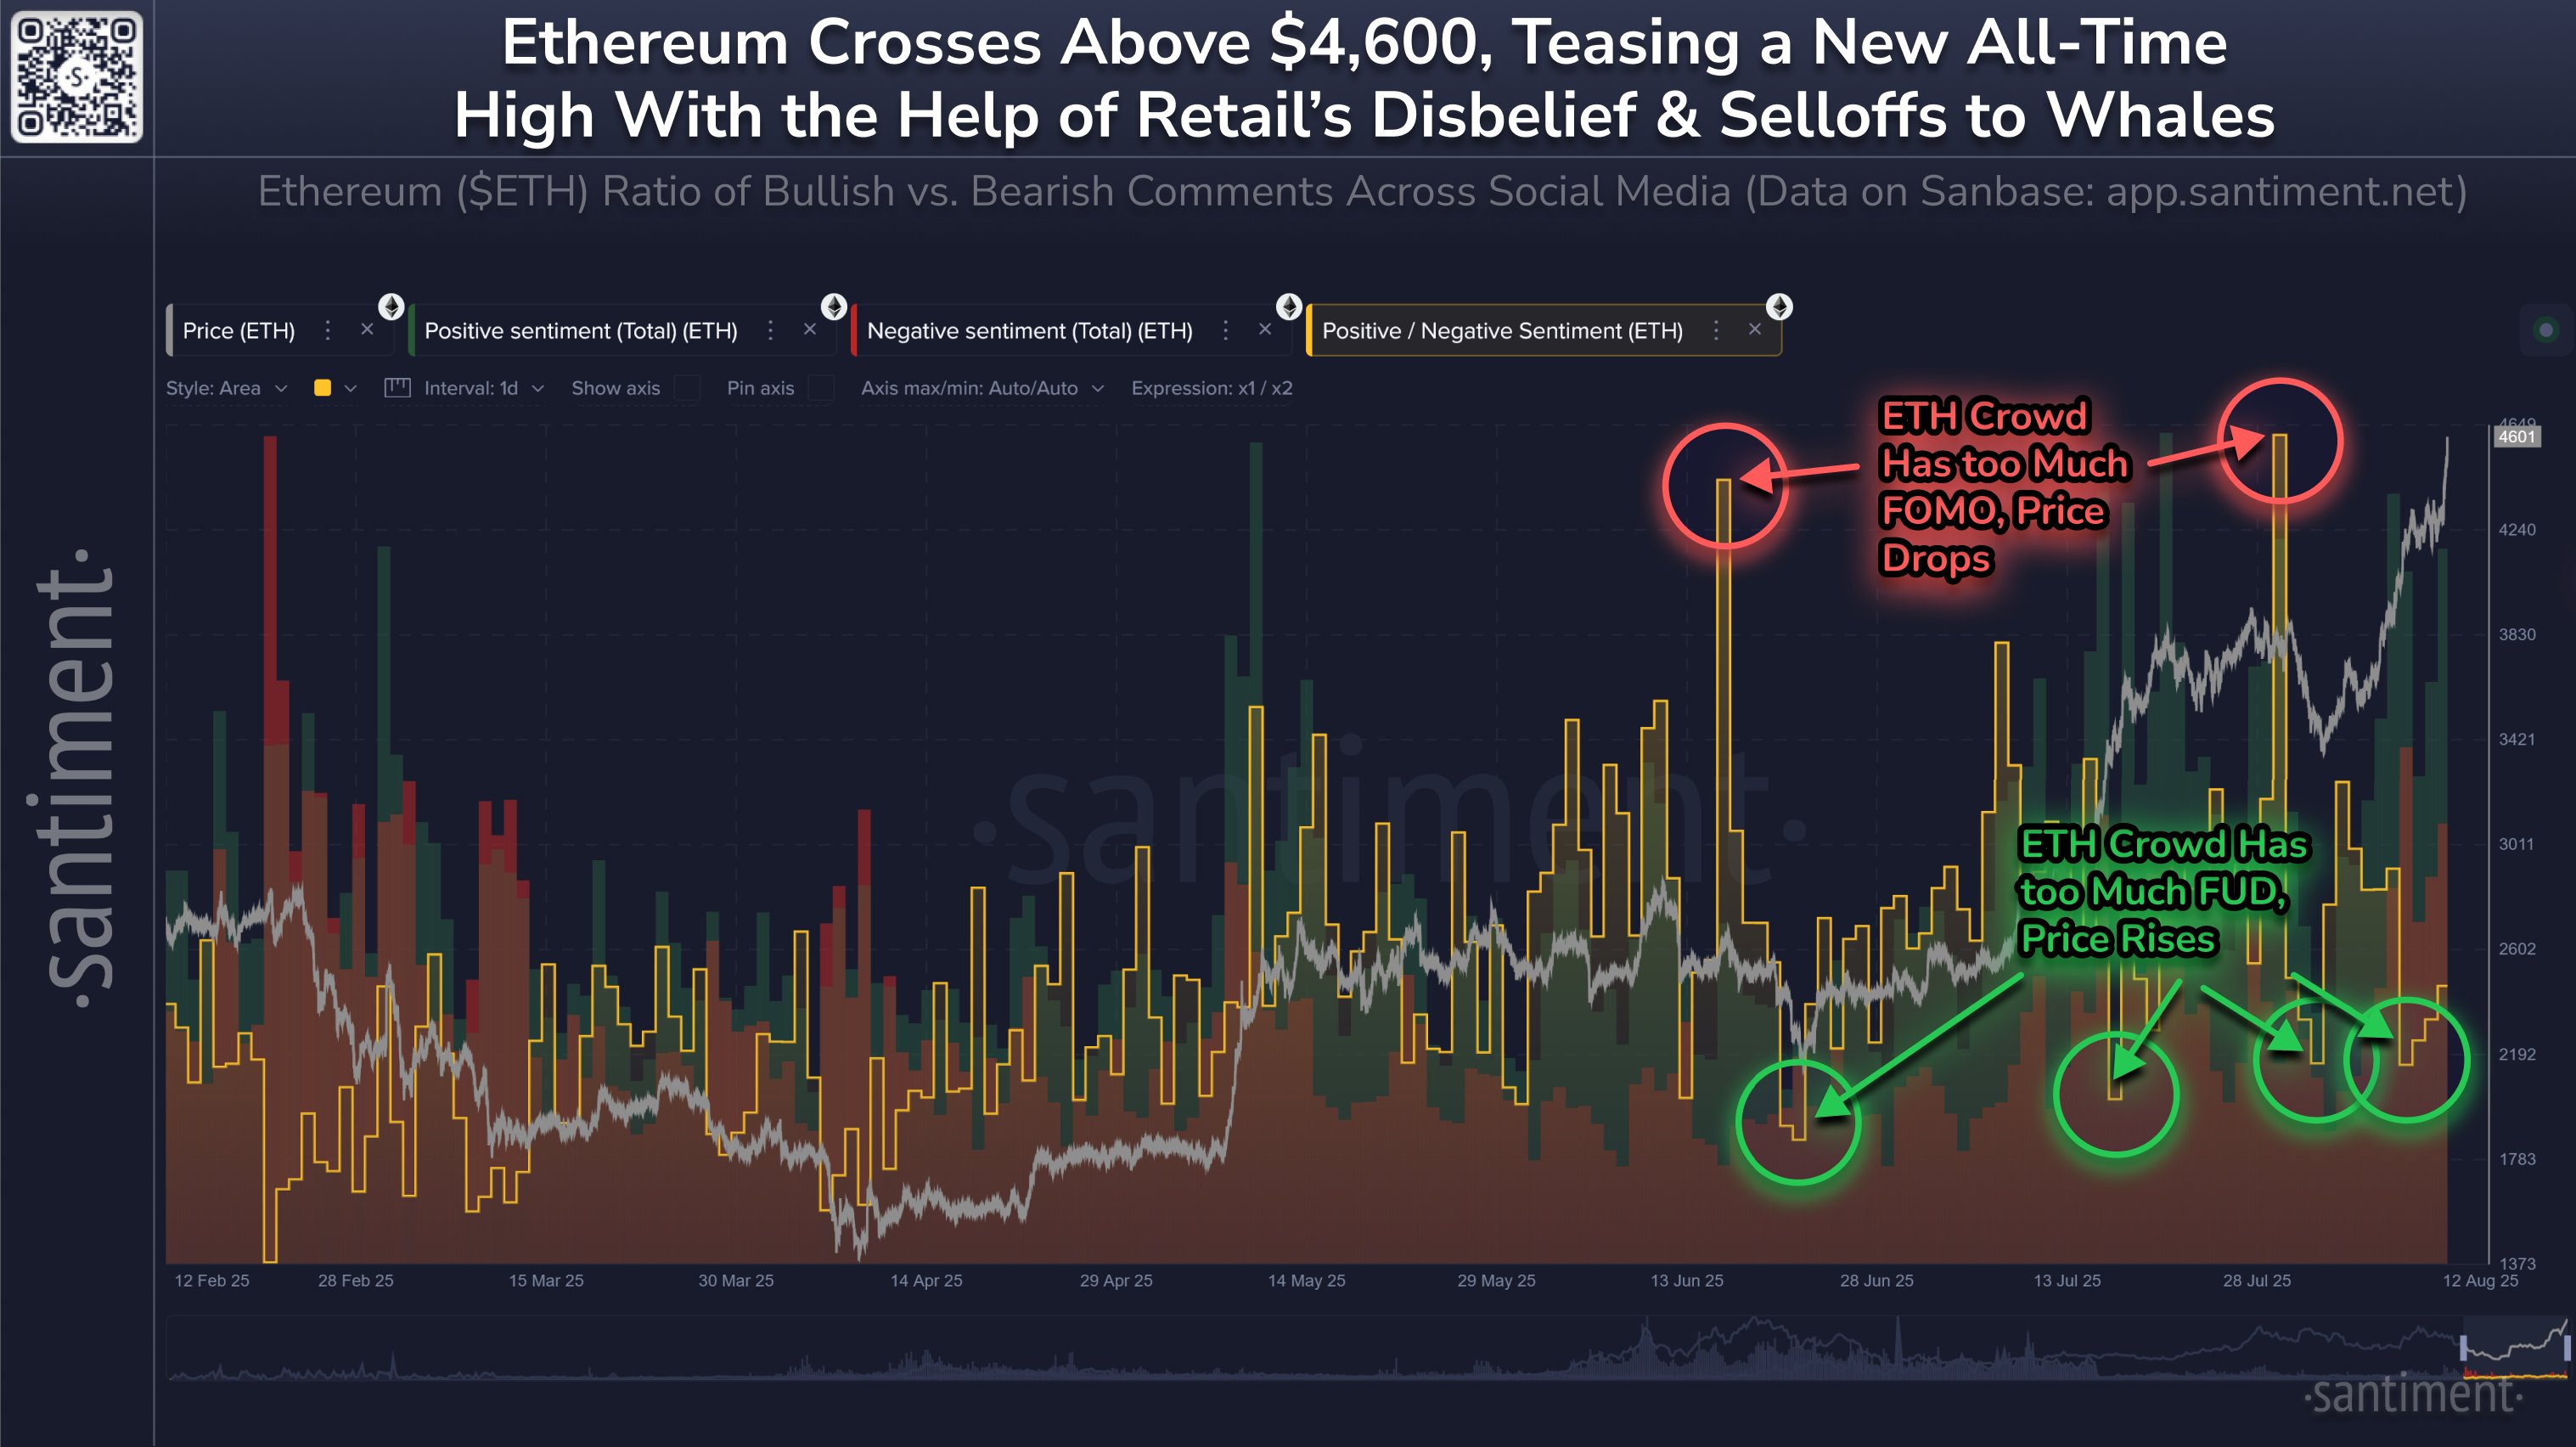
Ethereum Retail Mood Still Bearish: Perfect Setup For ATH Break?
Data shows Ethereum sentiment on social media doesn’t lean too bullish right now, something that cou...

XRP Ruling Sends Shockwaves Through The Financial System
The recent court ruling on XRP has proven to be more than just a legal win for Ripple. What began as...

Analyst Says What Happened With Bitcoin Is About To Happen With XRP
A growing sentiment in the cryptocurrency community suggests that XRP could be on the verge of becom...